
We use cookies, including third-party cookies from Google to serve personalized ads through AdSense, to operate this site and understand how it is used. By continuing to browse, you accept this use. See our Privacy Policy and Terms of Use for details, including how to opt out of personalized advertising.
Accept
SmartData CollectiveSmartData Collective
  • Analytics
    AnalyticsShow More
    Flat editorial illustration: The article is about joining public web signals with internal business metrics so BI teams can inter
    Alternative Data in BI: Bringing Public Web Data Into Your Dashboards
    23 Min Read
    Flat editorial illustration: The article is about automating the collection, preparation, and delivery of marketing data across p
    From Data to Dashboards: 5 Marketing Reporting Automation Software Picks
    12 Min Read
    Flat editorial illustration: The article contrasts passive follower totals with a behavioral path from attention and trust to cli
    Creator Analytics Beyond Follower Count: Seven Metrics That Measure Audience Behavior
    11 Min Read
    Flat editorial illustration: The article connects AI and marketing analytics with managerial judgment grounded in consumer behavi
    How an Online MBA in Marketing Connects AI and Data Analytics
    11 Min Read
    What Kind of Problem-Solving Distinguishes Data Analysts From Software Engineers -- AI-generated illustration
    What Kind of Problem-Solving Distinguishes Data Analysts From Software Engineers
    7 Min Read
  • Big Data
  • BI
  • Exclusive
  • IT
  • Marketing
  • Software
Search
© 2008-25 SmartData Collective. All Rights Reserved.
Reading: Auditing the State of Your Company’s Analytics Infrastructure in 6 Questions
Share
Notification
Font ResizerAa
SmartData CollectiveSmartData Collective
Font ResizerAa
Search
  • About
  • Help
  • Privacy
Follow US
© 2008-23 SmartData Collective. All Rights Reserved.
SmartData Collective > Analytics > Auditing the State of Your Company’s Analytics Infrastructure in 6 Questions
AnalyticsExclusive

Auditing the State of Your Company’s Analytics Infrastructure in 6 Questions

Matt James
Matt James
5 Min Read
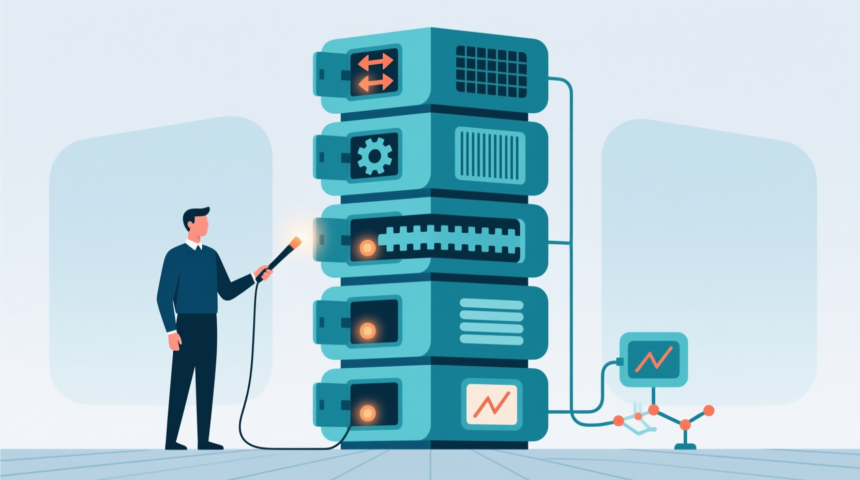
Auditing the State of Your Company's Analytics Infrastructure in 6 Questions
Illustration generated with Qwen Image.
SHARE

It’s no secret that everything businesses need to grow and accomplish their vision is theirs for the taking. But like anything that yields powerful results, the process doesn’t come easy. This describes the dilemma many organizations are facing when it comes to getting insights out of data.

Contents
  • How long does it take to deliver information to users?
  • Do you have the right architecture?
  • Can the business interpret and communicate about data?
  • Have company leaders bought into data?
  • How is data stored?
  • Can we tie any positive business outcomes to data?

But before enterprises can shore up their analytics processes, they need to understand what’s holding them back.

Audit the state of your company’s analytics infrastructure with these six questions.

How long does it take to deliver information to users?

In any analytics program, the goal is to collect raw data and turn it into interpretable information. Of course, many steps must happen in between collection and insight, but the length of time that it takes is the difference between being a reactive and proactive company. It’s also probably the determining factor for gaining an edge over competitors.

More Read

Analytics Changes the Calculus of Business Tax Compliance
How Email Deliverability Data Can Help You Choose the Best Email Marketing Platform
Smart Data Is Changing Multi-Board System Design
Data-Driven Affiliate Marketers Use Hourly Wage Calculators
How To Improve Cybersecurity With Data Science

Do you have the right architecture?

Just because data is abundant, doesn’t mean certain data sets aren’t sensitive. Companies collect all sorts of information and make sure it has the right architecture. At the same time, data needs to be accessed by relevant team members without delays or inaccuracies. Businesses need to lay out a centralized governance framework that defines procedures, roles, and responsibilities related to how data is transmitted throughout the organization.

This is no easy feat, which is why many enterprises are leveraging artificial intelligence architecture like ThoughtSpot for data analytics, ensuring a single version of the truth, access at scale, and custom permissions down to specific data rows.

Can the business interpret and communicate about data?

Innovations and operation-changing developments are rarely borne out of a vacuum. If they were, we wouldn’t need to be physically present at work. So, while collaboration is integral to making important decisions and fostering new ideas, a baseline needs to exist for productive discussions to occur. This is why it’s essential to develop a data literate culture. A company could do everything right, but if the data team is the only business unit fluent in data analysis and terminologies, it’ll have a hard time getting value.

Have company leaders bought into data?

This is more of a follow-up question than a standalone one. If employees across the workplace don’t possess a shared knowledge of how to interact with data, the reason is likely because leadership has failed to set a proper example. C-suite members like the Chief Data Officer and Data Evangelist need to work with the analytics team to demonstrate the importance of using data regularly. This doesn’t just mean rhetoric (though that’s important, too), but also a data lexicon and agreed-upon set of KPIs that align with overall business goals.

How is data stored?

Collecting a lot of data is a prerequisite to uncovering important insights. But the ever-growing amount of raw information in existence, and the many forms it comes in, makes data storage an intimidating initiative to solve. In the old days of business intelligence, companies had to buy on-premises hardware if they wanted to collect more data. This was costly, time-consuming, and inflexible, but being the only option, it worked. Now that we have the cloud, however, there’s no reason to opt for an on-premises-only strategy. Agile companies are using multi-cloud or hybrid cloud storage methods to keep their growing data volumes tidy, reducing costs in the process.

Can we tie any positive business outcomes to data?

Here comes the hard but necessary question: Have your analytics efforts meant anything to date? If you’re struggling to come up with use cases, you’re not alone. According to Gartner, 87 percent of organizations have low data and analytics maturity rates. Instead of wallowing in wasted time and money, consider this your organization’s turning point. Take what you’ve learned about the state of your analytics program from the above questions and use it as the blueprint for change.

Audits are never fun, but they are crucial to identifying the needed areas for improvement. Though your efforts may not have yielded much so far, take solace in the fact that analytics programs are never finished; they’re continually evolving and need regular fine-tuning for their full potential to be realized. This is what you’re doing as you audit the state of your analytics infrastructure.


TAGGED:analytics infrastructurecompany data analyticsdata analytics
Share This Article
Facebook Pinterest LinkedIn
Share
ByMatt James
Matt James is a veteran marketer & tech geek that has helped many large brands increase their online footprint. He specializes in influencer outreach and business growth.

Follow us on Facebook

Latest News

Flat editorial illustration: The article is about joining public web signals with internal business metrics so BI teams can inter
Alternative Data in BI: Bringing Public Web Data Into Your Dashboards
Big Data Business Intelligence Exclusive Web Analytics
Flat editorial illustration: A SaaS-editorial scene showing product usage, support patterns, and renewal feedback informing a fle
Using Product Usage Analytics and Support Data to Build a B2B Product Roadmap
Business Intelligence Infographic
From Hiring To Payroll: Managing HR Data Across Business Systems -- AI-generated illustration
From Hiring To Payroll: Managing HR Data Across Business Systems
Big Data Business Intelligence Infographic
Flat editorial illustration: The article is about automating the collection, preparation, and delivery of marketing data across p
From Data to Dashboards: 5 Marketing Reporting Automation Software Picks
Analytics Business Intelligence Exclusive Marketing

Stay Connected

1.2KFollowersLike
33.7KFollowersFollow
222FollowersPin

You Might also Like

Optimizing SaaS Pricing Strategy Based On Data Analysis
ExclusiveSaaS

Optimizing SaaS Pricing Strategy Based On Data Analysis

9 Min Read
Business Intelligence
AnalyticsBusiness IntelligencePredictive Analytics

Business Intelligence to Deliver the Real-time Business Answers

4 Min Read
Can Machine Learning Help Us Avoid Common Email Marketing Mistakes?
AnalyticsExclusiveMachine LearningMarketingWeb Analytics

Can Machine Learning Help Us Avoid Common Email Marketing Mistakes?

5 Min Read
Data-Driven Tips to Optimize the Speed of Macs
News

Data-Driven Tips to Optimize the Speed of Macs

12 Min Read

SmartData Collective is one of the largest & trusted community covering technical content about Big Data, BI, Cloud, Analytics, Artificial Intelligence, IoT & more.

From Bolts to Bots: How AI Is Fortifying the Automotive Industry
Artificial Intelligence
5 Great Tips for Using Data Analytics for Website UX
Big Data

Quick Link

  • About
  • Contact
  • Privacy
Follow US
© 2008-26 SmartData Collective. All Rights Reserved.
Welcome Back!

Sign in to your account

Username or Email Address
Password

Lost your password?