
We use cookies, including third-party cookies from Google to serve personalized ads through AdSense, to operate this site and understand how it is used. By continuing to browse, you accept this use. See our Privacy Policy and Terms of Use for details, including how to opt out of personalized advertising.
Accept
SmartData CollectiveSmartData Collective
  • Analytics
    AnalyticsShow More
    What Kind of Problem-Solving Distinguishes Data Analysts From Software Engineers -- AI-generated illustration
    What Kind of Problem-Solving Distinguishes Data Analysts From Software Engineers
    7 Min Read
    chatgpt image jul 21, 2026, 04 34 30 pm
    4 Core Benefits of Predictive Maintenance after Vibration Analysis
    10 Min Read
    How Does Data Mining Boost Customer Satisfaction in Logistics? Harnessing Analytics for Results -- AI-generated illustration
    How Does Data Mining Boost Customer Satisfaction in Logistics? Harnessing Analytics for Results
    11 Min Read
    chatgpt image jul 13, 2026, 04 23 45 pm
    How Data Analytics Helps Companies Improve User Engagement
    19 Min Read
    chatgpt image jul 13, 2026, 03 59 46 pm
    How Data Analytics Improves Multi-Location Search Strategies
    10 Min Read
  • Big Data
  • BI
  • Exclusive
  • IT
  • Marketing
  • Software
Search
© 2008-25 SmartData Collective. All Rights Reserved.
Reading: Webtrends Engage 2011: Making Web Analytics Sexy
Share
Notification
Font ResizerAa
SmartData CollectiveSmartData Collective
Font ResizerAa
Search
  • About
  • Help
  • Privacy
Follow US
© 2008-23 SmartData Collective. All Rights Reserved.
SmartData Collective > Big Data > Data Visualization > Webtrends Engage 2011: Making Web Analytics Sexy
AnalyticsData VisualizationSocial Data

Webtrends Engage 2011: Making Web Analytics Sexy

mfauscette
mfauscette
4 Min Read
Webtrends Engage 2011: Making Web Analytics Sexy
Illustration generated with FLUX.2 [klein 4B] via Cloudflare Workers AI.
SHARE

I spent a few days this week catching up with Webtrends during its annual user event, Engage, in San Francisco. Web analytics is covered in my IDC group under CRM analytics but as most of you know this isn’t something I spend a great deal of time researching, at least until recently. As I’ve spent more time on social business and specifically socialytics as a part of making social data actionable, I’ve realized that web data, while not “social” data per se, is behavioral data that can help build a true picture of customer behavior when combined with social data and enterprise customer data, especially transaction data. That’s how I first got interested in what Webtrends was doing, although I will say I’m very pleasantly surprised with several things I learned this week. First let’s look at this linkage to socialytics though. The following diagram shows the interconnected nature of the three data sources:

One of the most promising areas of socialytics comes as a result of using behavioral-cultural modeling techniques from sociology to analyze past behavior and to infer future action. Social data from public sources like facebook, Twitter, blogs, YouTube, etc. can be a rich source of information about individuals. Web analytics brings a second set of behavioral data to the mix and could help define a clearer picture of customer behavior.

Back to Webtrends and this weeks announcements though. Webtrends has a strong portfolio of products and services aimed at increasing marketing effectiveness. Here’s a chart that shows current offerings:

During Engage Webtrends announced the upcoming release of Analytics 10 with a completely revamped architecture, and user experience (UX). The release was designed around three concepts: 1. analytics across digital channels, 2. data beyond the tag (beyond site data) and 3. intelligent campaign discovery. To provide a broader view “beyond the tag”, Analytics 10 now includes the ability to analyze data from web sites, mobile apps and social sites like facebook. The new UX incorporates a new concept called spaces for tracking multiple channels which adds to the other two existing views, channels and groups. Here’s a screen shot of the spaces UI:

With this release Webtrends also moves to more of a marketing dashboard for cross campaign management, providing visibility to metrics across channels. In effect Analytics 10 could be a portfolio management tool for managing campaigns like a project portfolio management tool, something I believe CMO’s and other marketing executives sorely need in today’s rapidly changing marketing environment. With the emergence of social marketing making campaign decisions has to change from quarterly or monthly to a much shorter window and cross channel analytics will play a large role in this process. Establishing return on scarce marketing dollars is even more critical in a highly competitive and cash constrained business environment.

The new architecture positions Analytics 10 as a broader, cloud-based analytics platform with a lot of future expansion capability. Webtrends, which develops in the agile development model, plans 3 feature rich releases per year. As a part of this release Webtrends also revealed its new UI, which I have to say is very impressive. I’ve written often about how poor the UX is for many enterprise SW products. With this release Analytics 10 joins my short list of truly modern UX’s. Take a look at this screen shot:

Engage was a good showing for Webtrends and from what I could tell the word embodies the attitudes of the customers I met.
Share This Article
Facebook Pinterest LinkedIn
Share

Follow us on Facebook

Latest News

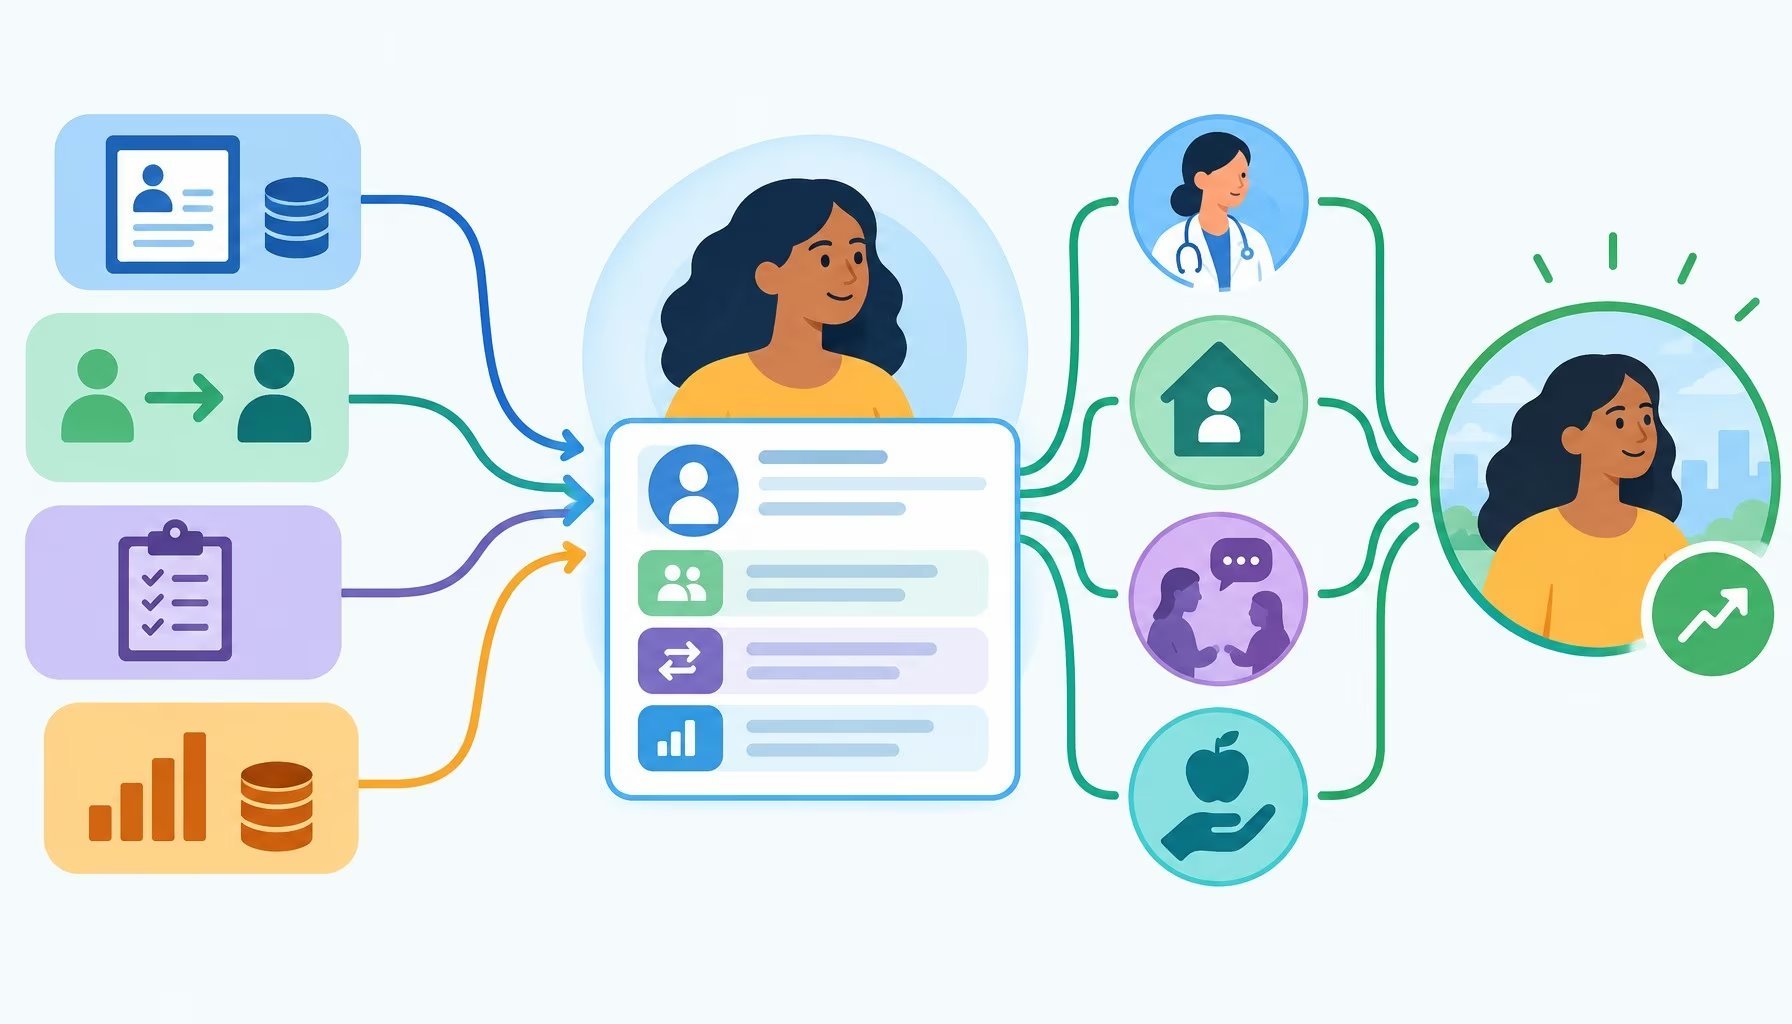
Flat editorial illustration: The article connects fragmented social-service records through shared pathways and selective informa
Turning Disconnected Information Data Into Better Social Service Outcomes
Big Data
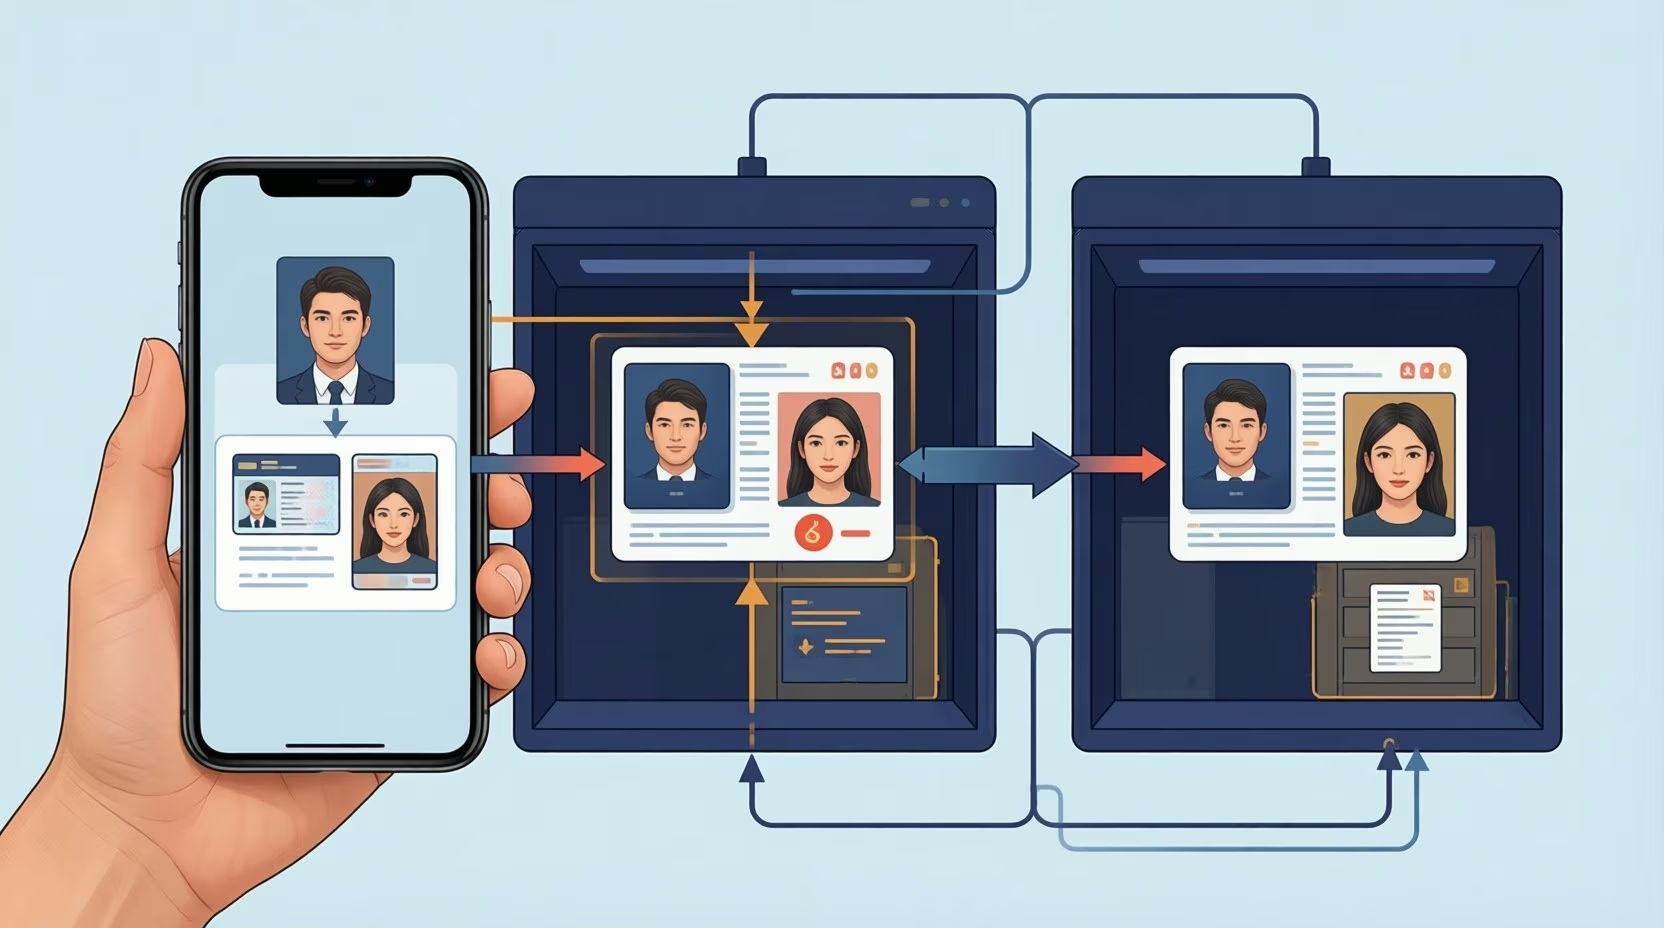
Flat editorial illustration: The article explains how one KYC upload becomes separate records held by a verification vendor and a
What Happens to My KYC Data Behind the Approval Screen?
Big Data Exclusive
Flat editorial illustration: The article connects AI-generated avatar variants with disciplined, measurable video experiments. A
How to Use an AI Avatar Generator to Run Measurable Video Experiments
Artificial Intelligence Exclusive
Flat editorial illustration: The article’s core relationship is between growing compute density and adaptable rack hardware that
6 Details That Make a Data Centre’s Server Room Easier to Scale
Best Practices Data Management Exclusive IT

Stay Connected

1.2KFollowersLike
33.7KFollowersFollow
222FollowersPin

You Might also Like

Connecting the Enterprise: The VMware - Lithium Technologies Partnership
CRMCulture/LeadershipSocial Data

Connecting the Enterprise: The VMware – Lithium Technologies Partnership

4 Min Read
How Mobile Analytics Can Help Marketers
AnalyticsMarketing

How Mobile Analytics Can Help Marketers

5 Min Read
Landscape:  Data Warehousing and Business Analytics
AnalyticsData Warehousing

Landscape: Data Warehousing and Business Analytics

5 Min Read
Helpful Forecasting Resources
AnalyticsData Management

Helpful Forecasting Resources

3 Min Read

SmartData Collective is one of the largest & trusted community covering technical content about Big Data, BI, Cloud, Analytics, Artificial Intelligence, IoT & more.

How To Get An Award Winning Giveaway Bot
Big Data Chatbots Exclusive
Artificial Intelligence for eCommerce: A Closer Look
Artificial Intelligence

Quick Link

  • About
  • Contact
  • Privacy
Follow US
© 2008-26 SmartData Collective. All Rights Reserved.
Welcome Back!

Sign in to your account

Username or Email Address
Password

Lost your password?