
Analytics technology is very important for online businesses. You need to pay close attention to analytics data on various KPIs to determine whether your strategy is working well and what tweaks need to be made.
As an eCommerce entrepreneur, you have the benefit of being able to access a plethora of data at any time about multiple areas of your business and how consumers interact with it. The good news is that there are loads of great analytics tools that online businesses can use to better understand their customers. Crazy Egg, Google Analytics, Voluum and other analytics tools make it a lot easier to create a well-optimized and profitable business.
Factors to Evaluate with Your Analytics Data
However, many new online store leaders don’t take nearly enough notice of the information available to them. They miss out on tweaking their business and improving sales as a result.
Analytics data can be very useful for companies trying to create profitable online business models. If this is an area you’ve been lax about to date, now is the time to get focused. Pay attention to the following metrics in your analytics dashboard to help you achieve greater success with your store.
More Read

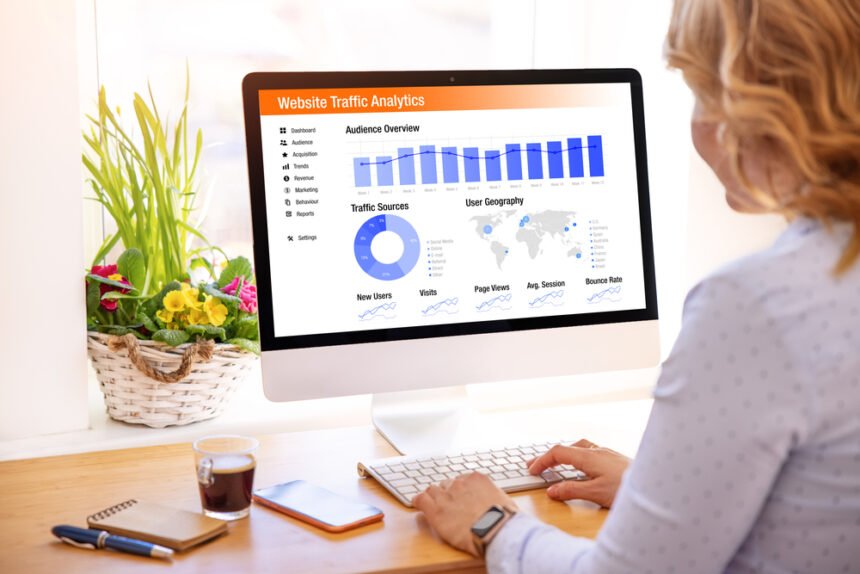
Audience Information
For starters, understand who your customers are and what they want. Analyzing data will give you insights into this. Use analytics software to learn things like geographic location, gender, interests, product preferences, prime shopping times, the devices used, search terms entered, and more.
It pays to utilize a quality session recording tool to see what people do when they’re on your site. See how people respond to the information and graphics presented, where they linger, click, and click away, how long they shop for, what they buy, and so on. The more metrics related to consumer behavior you can track and scrutinize, the better you’ll be able to target your website’s wares and processes to your clients and their needs.
Acquisition Costs
To obtain new leads, you’ll be investing in various marketing strategies. To ensure you spend your time and money on tactics that give you a decent return on investment, keep a close eye on customer acquisition costs. This metric is the average number you have to put in to get new customers.
Work out this cost by dividing the total amount you spend trying to win new clients by a particular period (e.g., month or quarter) and by the number of new customers you land over that timeframe. Calculate this average cost to check if the strategies you use right now are working for you or not. There’s no particular figure you have to meet here, because it varies depending on many factors, but the lower the number you come back with, the better.
If the figure is too high, it shows you’re spending too much on marketing and sales strategies that don’t work for you. Do remember, though, that your average customer acquisition cost is likely to reduce over time as you get more brand awareness in the market.
Conversion Rate
Another vital metric is the conversion rate. At what point does an online shopper turn into an actual customer for you? Over time, you want this conversion rate to decrease as you test and measure different facets of your website, the products you sell, the customer service you provide, and so on. Basically, you want people to convert into paying clients ASAP.
It also pays to do some segmented conversation rate calculations. While your general conversion figure gives you an overall success indicator, there’s more to learn. You can find other helpful insights to grow your business if you look at data such as conversions by traffic source (e.g., Google searches, blog links, direct URL type-ins, etc.) and conversion by device type, such as desktop or mobile use.
You might also check the conversation rate by visitor location, the number of new browsers who convert into sales versus returning shoppers, and conversion by product and category type.
Customer Lifetime Value
A great way to get an idea of how your business is tracking and where you might make some positive changes is to examine your company’s average customer lifetime value. That is, how much net profit will you typically receive from clients over the length of your relationship with them? This figure is based on how often people shop with you and how much they spend when they buy.
Calculate this metric by starting with the average dollar value of your sales (another metric worth watching). This number is basically how much customers spend per transaction on average. Take this amount and multiply it by the average number of transactions you get per customer, and then again by the average number of years you retain clients.
The higher this lifetime value equates to, the fewer shoppers you should need to turn a profit and keep your business running. This figure is helpful because it gives you an idea of how worthwhile it is “buying” each new customer and how much to spend on doing that. If the lifetime value is low, you don’t want to spend too much money on your customer acquisition costs or the investment won’t be worth it long term.
All this data will help you make better decisions for your business and discover helpful ways to improve how you operate it.
Analytics Data is Invaluable for Online Businesses
As the owner of an online business, you can’t afford to overlook the importance of analytics data. You should use your analytics dashboard to pay close attention to the KPIs addressed above. This will help your data-driven online business thrive in the years to come.


