



We use cookies, including third-party cookies from Google to serve personalized ads through AdSense, to operate this site and understand how it is used. By continuing to browse, you accept this use. See our Privacy Policy and Terms of Use for details, including how to opt out of personalized advertising.
Accept
SmartData CollectiveSmartData Collective
  • Analytics
    AnalyticsShow More
    Flat editorial illustration: The article is about joining public web signals with internal business metrics so BI teams can inter
    Alternative Data in BI: Bringing Public Web Data Into Your Dashboards
    23 Min Read
    Flat editorial illustration: The article is about automating the collection, preparation, and delivery of marketing data across p
    From Data to Dashboards: 5 Marketing Reporting Automation Software Picks
    12 Min Read
    Flat editorial illustration: The article contrasts passive follower totals with a behavioral path from attention and trust to cli
    Creator Analytics Beyond Follower Count: Seven Metrics That Measure Audience Behavior
    11 Min Read
    Flat editorial illustration: The article connects AI and marketing analytics with managerial judgment grounded in consumer behavi
    How an Online MBA in Marketing Connects AI and Data Analytics
    11 Min Read
    What Kind of Problem-Solving Distinguishes Data Analysts From Software Engineers -- AI-generated illustration
    What Kind of Problem-Solving Distinguishes Data Analysts From Software Engineers
    7 Min Read
  • Big Data
  • BI
  • Exclusive
  • IT
  • Marketing
  • Software
Search
© 2008-25 SmartData Collective. All Rights Reserved.
Reading: Know Your Numbers: The Dollar-Driven Guide to Holiday Emails
Share
Notification
Font ResizerAa
SmartData CollectiveSmartData Collective
Font ResizerAa
Search
  • About
  • Help
  • Privacy
Follow US
© 2008-23 SmartData Collective. All Rights Reserved.
SmartData Collective > IT > Cloud Computing > Know Your Numbers: The Dollar-Driven Guide to Holiday Emails
Cloud ComputingCRMData MiningMarketingMarketing AutomationWeb Analytics

Know Your Numbers: The Dollar-Driven Guide to Holiday Emails

Cassie Young
Cassie Young
4 Min Read
Know Your Numbers: The Dollar-Driven Guide to Holiday Emails
Illustration generated with Qwen Image.
SHARE

Our commerce clients are deep in the throes of holiday season, and with their planning and activity has come an influx of questions about best practices for emailing during the holiday season. I decided to let the data speak for itself!

More specifically, our team analyzed over 4.2 billion emails sent by our commerce clients in 2012 and 2013 to distill trends around which holidays drive the greatest return (read: dollars!) in terms of email marketing.
 
To do this, we examined 3 key metrics:
  • Open Rate – the thought process here went something like, “people complain about getting emails on Christmas day – but do they open those emails?”
  • Revenue per Open – how valuable was any given email open?
  • Revenue per 1,000 Emails Sent (RPM) – How much money is made for every thousand emails deployed? This metric is a balancing act for the first two figures (e.g. if open rate is very low but revenue per open is high, is quality enough to offset the deficit in quantity)?
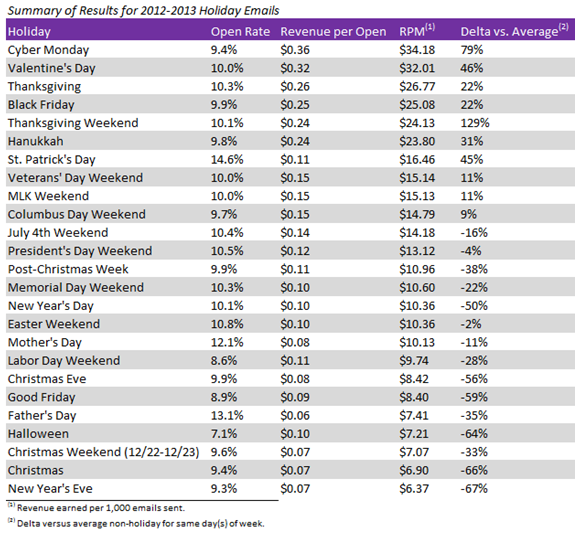
From there, we compared the RPM metric against an “average” day; in other words, if we were looking at Cyber Monday, we compared its RPM against all non-holiday Mondays in a given year. To keep things interesting, we included all of the federal holidays as well as select “Hallmark” holidays.
Image
 
Full results are in the table above, but here are some notable highlights:
  • Generally speaking, open rates are materially lower on holidays than non-holidays, but the value of any given open will often be stronger on holidays vs. non.
  • Not surprisingly, Cyber Monday proved the most valuable in terms of RPM; interestingly, Valentine’s Day was a close second.
  • In terms of lift overall versus an average day, Thanksgiving weekend (the Saturday and Sunday after the holiday), proved most compelling for email marketing with a 129% improvement over the typical weekend. New Year’s Eve showcased the most marked decline vs. a typical day.
  • There are several holidays/holiday weekends where retailers will see a major decline vs. average non-holiday days; in these instances, even sales cannot adequately buffer the engagement and conversion gaps.
  • December (well, pre-Christmas December) is a powerful month across the board, but 12/1-12/14 – which included much of Hanukkah last year – proved more valuable than 12/15-12/21 ($23.59 RPM vs. $20.88), so for commerce brands the indicator is to start those campaigns early!
  • The final days leading up to Christmas present the worst possible times to reap immediate benefits from email marketing (probably because it’s often too late to guarantee holiday arrivals!).

These results will obviously vary from business to business, but my hope is that these aggregate findings will be helpful from a directional perspective. As always, we recommend data-driven marketers conduct their own congruent analysis and urge them to focus on real value and conversion versus top-of-funnel metrics such as opens or clicks.


Share This Article
Facebook Pinterest LinkedIn
Share

Follow us on Facebook

Latest News

Flat editorial illustration: The article compares proxy MCP servers by what an AI agent can do through them: manage proxy account
Proxy MCP Servers: 7 Options and What Each Lets an AI Agent Do
Artificial Intelligence Big Data Data Collection
Flat editorial illustration: The article is about joining public web signals with internal business metrics so BI teams can inter
Alternative Data in BI: Bringing Public Web Data Into Your Dashboards
Big Data Business Intelligence Exclusive Web Analytics
Flat editorial illustration: A SaaS-editorial scene showing product usage, support patterns, and renewal feedback informing a fle
Using Product Usage Analytics and Support Data to Build a B2B Product Roadmap
Business Intelligence Infographic
From Hiring To Payroll: Managing HR Data Across Business Systems -- AI-generated illustration
From Hiring To Payroll: Managing HR Data Across Business Systems
Big Data Business Intelligence Infographic

Stay Connected

1.2KFollowersLike
33.7KFollowersFollow
222FollowersPin

You Might also Like

Validation, Correction, and Conversion: Presenting the PMML Converter!
Data Mining

Validation, Correction, and Conversion: Presenting the PMML Converter!

6 Min Read
Should You Divorce Your Customer? CRM Analytics Can Tell You If It’s Time to Split
AnalyticsBest PracticesCRM

Should You Divorce Your Customer? CRM Analytics Can Tell You If It’s Time to Split

4 Min Read
Analytics, Schmanalytics! How to Evaluate an Analyst
Business IntelligenceCRMData MiningInside CompaniesPredictive Analytics

Analytics, Schmanalytics! How to Evaluate an Analyst

9 Min Read
No Time to Waste! 5 Essential Features for Your Information Intelligence Solution
Data ManagementData MiningKnowledge ManagementPredictive AnalyticsSentiment AnalyticsText AnalyticsUnstructured DataWeb Analytics

No Time to Waste! 5 Essential Features for Your Information Intelligence Solution

6 Min Read

SmartData Collective is one of the largest & trusted community covering technical content about Big Data, BI, Cloud, Analytics, Artificial Intelligence, IoT & more.

Artificial Intelligence for eCommerce: A Closer Look
Artificial Intelligence
AI chatbots
AI Chatbots Can Help Retailers Convert Live Broadcast Viewers into Sales!
Chatbots

Quick Link

  • About
  • Contact
  • Privacy
Follow US
© 2008-26 SmartData Collective. All Rights Reserved.
Welcome Back!

Sign in to your account

Username or Email Address
Password

Lost your password?