
We use cookies, including third-party cookies from Google to serve personalized ads through AdSense, to operate this site and understand how it is used. By continuing to browse, you accept this use. See our Privacy Policy and Terms of Use for details, including how to opt out of personalized advertising.
Accept
SmartData CollectiveSmartData Collective
  • Analytics
    AnalyticsShow More
    What Kind of Problem-Solving Distinguishes Data Analysts From Software Engineers -- AI-generated illustration
    What Kind of Problem-Solving Distinguishes Data Analysts From Software Engineers
    7 Min Read
    chatgpt image jul 21, 2026, 04 34 30 pm
    4 Core Benefits of Predictive Maintenance after Vibration Analysis
    10 Min Read
    How Does Data Mining Boost Customer Satisfaction in Logistics? Harnessing Analytics for Results -- AI-generated illustration
    How Does Data Mining Boost Customer Satisfaction in Logistics? Harnessing Analytics for Results
    11 Min Read
    chatgpt image jul 13, 2026, 04 23 45 pm
    How Data Analytics Helps Companies Improve User Engagement
    19 Min Read
    chatgpt image jul 13, 2026, 03 59 46 pm
    How Data Analytics Improves Multi-Location Search Strategies
    10 Min Read
  • Big Data
  • BI
  • Exclusive
  • IT
  • Marketing
  • Software
Search
© 2008-25 SmartData Collective. All Rights Reserved.
Reading: BI For Fun – Who Were the Dr Who Villains & What Were Their Motivations to End the World?
Share
Notification
Font ResizerAa
SmartData CollectiveSmartData Collective
Font ResizerAa
Search
  • About
  • Help
  • Privacy
Follow US
© 2008-23 SmartData Collective. All Rights Reserved.
SmartData Collective > Big Data > Data Visualization > BI For Fun – Who Were the Dr Who Villains & What Were Their Motivations to End the World?
Business IntelligenceData Visualization

BI For Fun – Who Were the Dr Who Villains & What Were Their Motivations to End the World?

BIME
BIME
2 Min Read
BI For Fun – Who Were the Dr Who Villains & What Were Their Motivations to End the World?
Photo by geralt on Pixabay (https://pixabay.com/photos/smartphone-calendar-agenda-arrows-3811634/)
SHARE

It’s not every day you see a data visualization on the popular TV series, Dr Who. Our Dr Who dashboard contains Dr Who villain data from 1963 to 2010, including motivation to end the world…

Did you know? The Doctor has fought more than 300 villains and monsters in his time. Find out who they are – and which appeared most, as well as when they first hit the screens. However, the data doesn’t include villains exclusively in Doctor Who books, audio books and spin-off shows – only the televised serials and only enemies (as opposed to protagonists).

The infamous Dalek has appeared more times than any other Doctor Who villain.

Have some interesting data you want to analyze? Start now.

This particular data was sourced from: The Guardian Data Blog.

More Read

SAS Global Forum: Is Google Analytics and SAS BI a Good Subject?
Black Swan Alert: Low Tech Links Devastate High Tech Supply Chains
Top 10 Excuses to Avoid Business Rules: #1 You want business users to do what?!
Infographics Get Pinned on Pinterest
Big Data Is Already A Thing Of The Past: Welcome To Big Data AI

Data Format: (Online) – Google Spreadsheet.

Click on the image below to access the dashboard.

drwho BI For Fun   Who Were The Dr Who Villians & What Were Their Motivations To End The World? [DASHBOARD]

Share This Article
Facebook Pinterest LinkedIn
Share

Follow us on Facebook

Latest News

Flat editorial illustration: The article connects fragmented social-service records through shared pathways and selective informa
Turning Disconnected Information Data Into Better Social Service Outcomes
Big Data
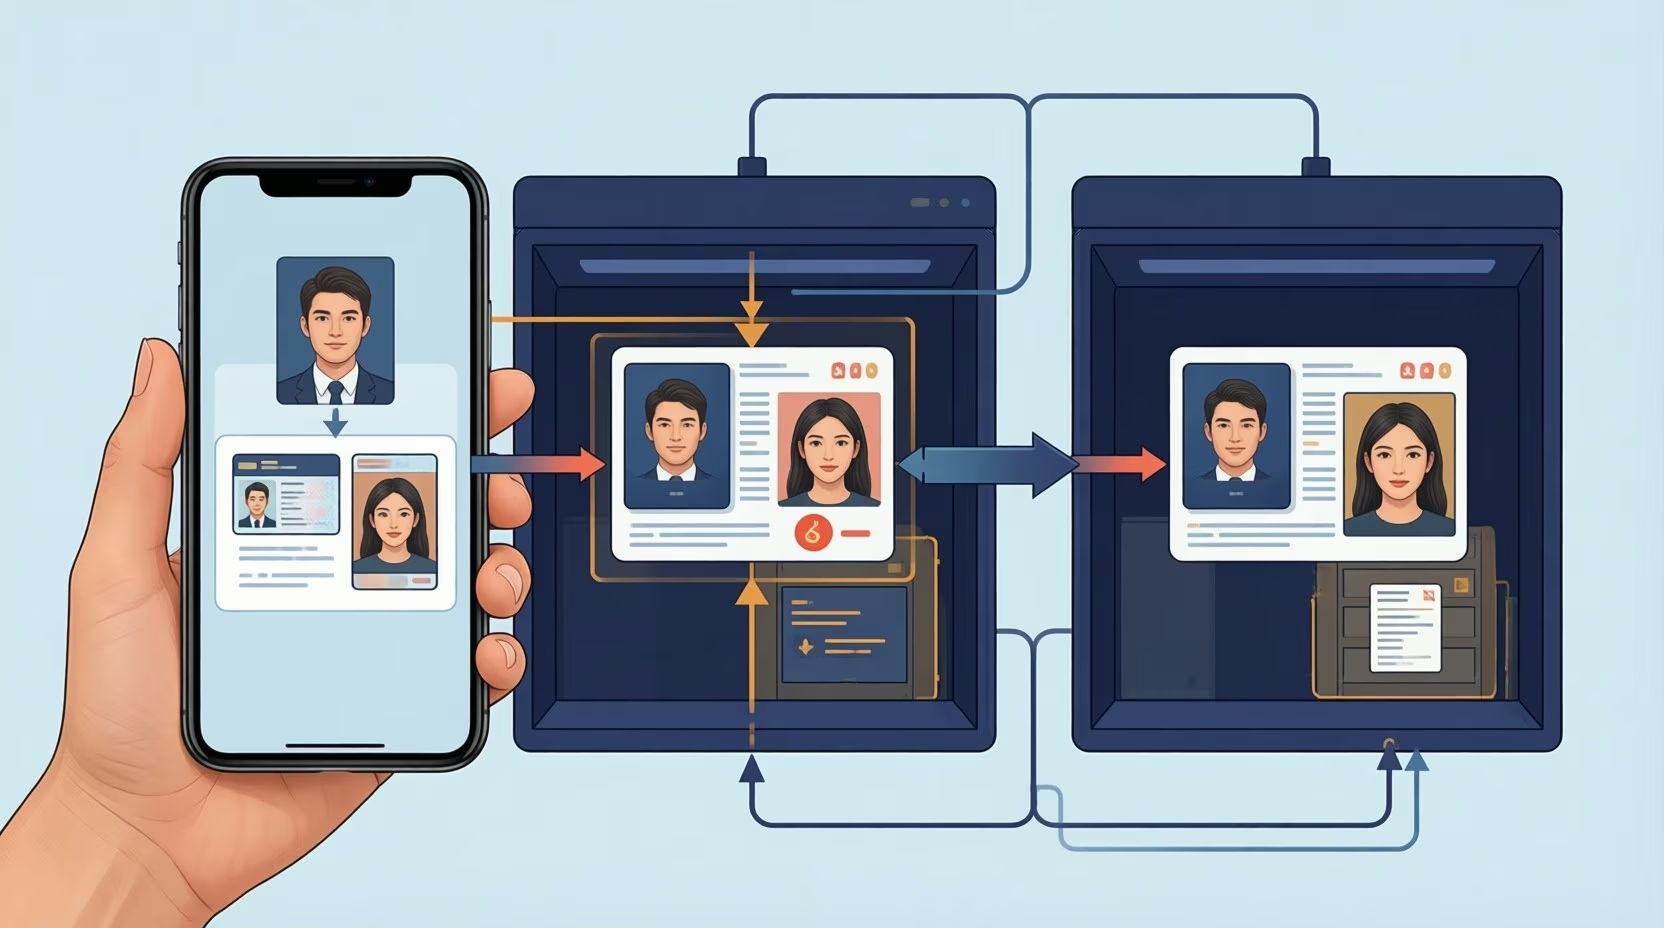
Flat editorial illustration: The article explains how one KYC upload becomes separate records held by a verification vendor and a
What Happens to My KYC Data Behind the Approval Screen?
Big Data Exclusive
Flat editorial illustration: The article connects AI-generated avatar variants with disciplined, measurable video experiments. A
How to Use an AI Avatar Generator to Run Measurable Video Experiments
Artificial Intelligence Exclusive
Flat editorial illustration: The article’s core relationship is between growing compute density and adaptable rack hardware that
6 Details That Make a Data Centre’s Server Room Easier to Scale
Best Practices Data Management Exclusive IT

Stay Connected

1.2KFollowersLike
33.7KFollowersFollow
222FollowersPin

You Might also Like

Free BI for Higher Ed
Business IntelligenceData Warehousing

Free BI for Higher Ed

5 Min Read
3 Common Payroll Errors That Can Be Resolved with AI Solutions
Big Data

3 Common Payroll Errors That Can Be Resolved with AI Solutions

6 Min Read
Taking Data Visibility to the Office Walls
AnalyticsBig DataData VisualizationWorkforce Analytics

Taking Data Visibility to the Office Walls

4 Min Read
Maybe it should be "Networked Business"?
Business Intelligence

Maybe it should be “Networked Business”?

4 Min Read

SmartData Collective is one of the largest & trusted community covering technical content about Big Data, BI, Cloud, Analytics, Artificial Intelligence, IoT & more.

Chatbots and SEO: How Can Chatbots Improve Your SEO Ranking?
Artificial Intelligence Chatbots Exclusive
AI chatbots
AI Chatbots Can Help Retailers Convert Live Broadcast Viewers into Sales!
Chatbots

Quick Link

  • About
  • Contact
  • Privacy
Follow US
© 2008-26 SmartData Collective. All Rights Reserved.
Welcome Back!

Sign in to your account

Username or Email Address
Password

Lost your password?