We use cookies, including third-party cookies from Google to serve personalized ads through AdSense, to operate this site and understand how it is used. By continuing to browse, you accept this use. See our Privacy Policy and Terms of Use for details, including how to opt out of personalized advertising.
Accept
SmartData CollectiveSmartData Collective
  • Analytics
    AnalyticsShow More
    chatgpt image jul 21, 2026, 04 34 30 pm
    4 Core Benefits of Predictive Maintenance after Vibration Analysis
    10 Min Read
    How Does Data Mining Boost Customer Satisfaction in Logistics? Harnessing Analytics for Results -- AI-generated illustration
    How Does Data Mining Boost Customer Satisfaction in Logistics? Harnessing Analytics for Results
    11 Min Read
    chatgpt image jul 13, 2026, 04 23 45 pm
    How Data Analytics Helps Companies Improve User Engagement
    19 Min Read
    chatgpt image jul 13, 2026, 03 59 46 pm
    How Data Analytics Improves Multi-Location Search Strategies
    10 Min Read
    cybersecurity efforts
    How Behavioral Analytics and AI Are Redefining Cybersecurity for Boca Raton Businesses
    14 Min Read
  • Big Data
  • BI
  • Exclusive
  • IT
  • Marketing
  • Software
Search
© 2008-25 SmartData Collective. All Rights Reserved.
Reading: Benchmarks Can Reveal the Finance Department’s Achilles Heel
Share
Notification
Font ResizerAa
SmartData CollectiveSmartData Collective
Font ResizerAa
Search
  • About
  • Help
  • Privacy
Follow US
© 2008-23 SmartData Collective. All Rights Reserved.
SmartData Collective > Business Intelligence > Market Research > Benchmarks Can Reveal the Finance Department’s Achilles Heel
Market Research

Benchmarks Can Reveal the Finance Department’s Achilles Heel

David Kasabian
David Kasabian
2 Min Read
Benchmarks Can Reveal the Finance Department's Achilles Heel
Illustration generated with FLUX.2 [klein 4B] via Cloudflare Workers AI.
SHARE

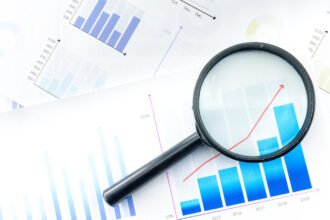
Data published in a recent infographic (www.tagetik.com/infographic) based on survey information compiled by APQC shows that the cost of finance is approximately 3x higher for bottom performing finance organizations than top performing organizations.  This highlights that while many large businesses are very mature in their elimination of spreadsheets and taking advantage of performance management products or suites many others still lag behind.

Data published in a recent infographic (www.tagetik.com/infographic) based on survey information compiled by APQC shows that the cost of finance is approximately 3x higher for bottom performing finance organizations than top performing organizations.  This highlights that while many large businesses are very mature in their elimination of spreadsheets and taking advantage of performance management products or suites many others still lag behind.  This infographic also shows the comparison of top and bottom performers in key areas such as the cost and duration of the budgeting process and financial reporting and the number of FTEs that are consumed by the budget process and to do financial reporting and analysis.

The reality in today’s environment is that finance is being asked to do more (more frequent forecasting, more indepth management and board reporting, more compliance and disclosure reporting, and more analysis) but often without any increase in staff.  Something has got to give or the trend will be that more companies become bottom performers.  Getting more for existing resources will the difference between top performers and bottom performers going forward.  Finance organizations should benchmark themselves against their peers to find the processes where they should focus their efficiency efforts to get the most out of existing resources


Share This Article
Facebook Pinterest LinkedIn
Share

Follow us on Facebook

Latest News

How Search Engine Indexing Lags Behind Large-Scale Website Domain Migrations -- AI-generated illustration
How Search Engine Indexing Lags Behind Large-Scale Website Domain Migrations
News
How Great Content Moves Through A Marketing Ecosystem -- AI-generated illustration
How Great Content Moves Through A Marketing Ecosystem
Exclusive Infographic Marketing
What Your Brand Misses That Data Reveals -- AI-generated illustration
What Your Brand Misses That Data Reveals
Big Data Exclusive Infographic
5 Common Mistakes Businesses Make During the Risk Assessment Process -- AI-generated illustration
5 Common Mistakes Businesses Make During the Risk Assessment Process
Business Intelligence Exclusive Risk Management

Stay Connected

1.2KFollowersLike
33.7KFollowersFollow
222FollowersPin

You Might also Like

New White Paper on Uplift Modeling with Predictive Analytics
Market ResearchPredictive Analytics

New White Paper on Uplift Modeling with Predictive Analytics

2 Min Read
Text Analytics WIIFM (What’s in it for Me?)
AnalyticsCRMCulture/LeadershipData MiningExclusiveMarket ResearchPredictive AnalyticsSentiment AnalyticsStatisticsText AnalyticsUnstructured Data

Text Analytics WIIFM (What’s in it for Me?)

7 Min Read
Projected Growth Rates of the BI Software and Big Data Analytics Markets [VIDEO]
AnalyticsBig DataBusiness IntelligenceCommentaryCulture/LeadershipData VisualizationMarket ResearchNewsPolicy and Governance

Projected Growth Rates of the BI Software and Big Data Analytics Markets [VIDEO]

2 Min Read
Do not make the biggest survey mistake!
Data QualityMarket Research

Do not make the biggest survey mistake!

2 Min Read

SmartData Collective is one of the largest & trusted community covering technical content about Big Data, BI, Cloud, Analytics, Artificial Intelligence, IoT & more.

ai chatbot
How AI Website Chatbots Improve Customer Support and Lead Generation
Chatbots Exclusive
How To Get An Award Winning Giveaway Bot
Big Data Chatbots Exclusive

Quick Link

  • About
  • Contact
  • Privacy
Follow US
© 2008-26 SmartData Collective. All Rights Reserved.
Welcome Back!

Sign in to your account

Username or Email Address
Password

Lost your password?