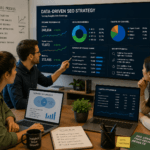
If you know me, you know I’m a very visual person. I learn by watching, I enjoy pictures so much I do photography in my spare time, and, the data geek in me loves infographics. So, I started poking around looking for some cool infographics and found some in the social media space.
If you know me, you know I’m a very visual person. I learn by watching, I enjoy pictures so much I do photography in my spare time, and, the data geek in me loves infographics. So, I started poking around looking for some cool infographics and found some in the social media space.
Paul Butler, part of Facebook’s data infrastructure team, took just 2% of Facebook’s user data (10 million records) and compiled this beautiful image that shows how we connect within our countries and around the world. While it looks a lot like a map of airline routes, its’ really a map of our human relationships.

LinkedIn is also demonstrating their use of the massive amount of data they’ve collected with Linkedin Maps. Only this time, it the infographic created is about you. LinkedIn’s new Maps feature builds an infographic that shows all of your connections, grouped together by color, and their connection to you is sized by how many shared connections you have between you. The hard part though, is figuring out just how they grouped your connections by color. You have to deduce that yourself.
Here’s a quick video about the maps.
And, here is my LinkedIn Map:

You can get your own LinkedIn Map here.
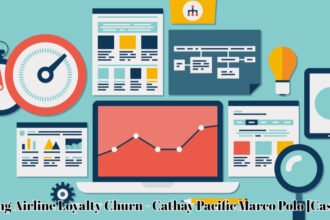
Finally, here is a fun Twitter infographic by Hubspot. Did you know you can grade your Twitter account? The average score is 66%. This map shows how each state’s average compares to the national average. How is your state doing? Get your own grade here. (not bragging, but mine is 95!)

More connections, better networking
So, what does all this mean? First, that social media has connected us in ways never before possible. It’s given us access to people and their ideas that would have been impossible just a decade ago. Now it’s easy to hook up with like-minded people, building our community of friends, expanding our possibilities for finding a life partner, or furthering our business or career.
Social data, better understanding
For the first time in history, social data about human activities is being collected and archived. Social scientists are drooling to get their hands on it to study global trends of all kinds, like health issues, economic changes, and lifestyle habits.
Social media has significantly changed my life for the better, giving me access to people that have helped make my business successful. Has it changed yours in any way?