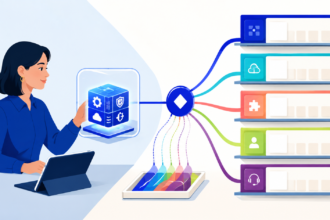
Many organizations delay system upgrades because existing tools appear functional. Reports still generate, data still flows, and daily tasks get done. Financial analytics tells a different story. When leaders look beyond surface performance, they often find that legacy systems quietly drain resources, distort decision-making, and slow growth in ways that are difficult to detect without deeper analysis.
Productivity Loss Hidden in Plain Sight
One of the most common findings from financial analytics is lost productivity. Older systems frequently rely on manual workarounds, duplicate data entry, and spreadsheet-based fixes. These tasks add minutes to individual workflows, but analytics show how those minutes compound across teams and months.
Time tracking and cost allocation data often reveal that employees spend significant hours reconciling data, correcting errors, or exporting information between systems that do not integrate well. The financial impact appears as higher labor costs without a corresponding increase in output, a gap that can persist unnoticed for years.
Delayed Decisions Carry Real Financial Weight
Speed matters in data-driven environments. Financial analytics highlights how outdated systems slow access to accurate information. When reports take days instead of minutes to compile, decisions rely on historical snapshots rather than current conditions.
More Read

This lag affects pricing, inventory management, investment timing, and risk assessment. Analytics models frequently show missed revenue opportunities linked to delayed insights. While these losses rarely appear as line items, they show up clearly when comparing forecast accuracy and response times across system generations.
Error Rates and Compliance Exposure
Legacy platforms often lack automated validation and real-time monitoring. Financial analytics can quantify how error rates increase when systems depend heavily on manual processes. Even small inaccuracies create downstream costs through rework, audit adjustments, or compliance reviews.
For regulated industries, these risks grow more serious. Analytics dashboards often flag patterns such as recurring corrections or late filings that trace back to system limitations. The cost of addressing these issues typically exceeds the price of modernization, yet remains hidden until measured directly.
Opportunity Cost of Limited Scalability
As organizations grow, older systems struggle to scale. Financial analytics helps isolate the cost of growth friction. This includes slower onboarding of new customers, delayed market expansion, or the inability to support new services.
When analytics compares performance across business units using different tools, the gap becomes clear. Modern platforms support advanced forecasting, automation, and scenario analysis that legacy systems cannot match. These differences translate into faster execution and better capital use.
Fragmented Data Reduces Strategic Clarity
Disconnected systems create fragmented data views. Financial analytics shows how this fragmentation weakens strategic planning. Leaders may see revenue trends in one tool and cost drivers in another, without a unified perspective.
Integrated platforms, including wealth management data solutions, allow organizations to connect financial, operational, and customer data in a single environment. Analytics from these systems provide clearer insights into profitability drivers and long-term performance trends that siloed tools obscure.
Measuring the Real Cost of Delay
The true expense of not switching systems rarely appears as a single number. Financial analytics brings these hidden costs together by quantifying lost time, missed opportunities, increased risk, and slower growth. When viewed collectively, the cost of delay often outweighs the investment required for change.
Organizations that rely on analytics to evaluate system performance gain a clearer picture of where value erodes. With that visibility, leaders can move beyond assumptions and make informed decisions about modernization that support accuracy, agility, and long-term resilience. Look over the infographic below for more information.