We use cookies, including third-party cookies from Google to serve personalized ads through AdSense, to operate this site and understand how it is used. By continuing to browse, you accept this use. See our Privacy Policy and Terms of Use for details, including how to opt out of personalized advertising.
Accept
SmartData CollectiveSmartData Collective
  • Analytics
    AnalyticsShow More
    Flat editorial illustration: The article is about joining public web signals with internal business metrics so BI teams can inter
    Alternative Data in BI: Bringing Public Web Data Into Your Dashboards
    23 Min Read
    Flat editorial illustration: The article is about automating the collection, preparation, and delivery of marketing data across p
    From Data to Dashboards: 5 Marketing Reporting Automation Software Picks
    12 Min Read
    Flat editorial illustration: The article contrasts passive follower totals with a behavioral path from attention and trust to cli
    Creator Analytics Beyond Follower Count: Seven Metrics That Measure Audience Behavior
    11 Min Read
    Flat editorial illustration: The article connects AI and marketing analytics with managerial judgment grounded in consumer behavi
    How an Online MBA in Marketing Connects AI and Data Analytics
    11 Min Read
    What Kind of Problem-Solving Distinguishes Data Analysts From Software Engineers -- AI-generated illustration
    What Kind of Problem-Solving Distinguishes Data Analysts From Software Engineers
    7 Min Read
  • Big Data
  • BI
  • Exclusive
  • IT
  • Marketing
  • Software
Search
© 2008-25 SmartData Collective. All Rights Reserved.
Reading: Market Research in 3-D! – For Market Research, Social Networks Is to 2009 as what the Online Survey was in 1998
Share
Notification
Font ResizerAa
SmartData CollectiveSmartData Collective
Font ResizerAa
Search
  • About
  • Help
  • Privacy
Follow US
© 2008-23 SmartData Collective. All Rights Reserved.
SmartData Collective > Business Intelligence > CRM > Market Research in 3-D! – For Market Research, Social Networks Is to 2009 as what the Online Survey was in 1998
Business IntelligenceCRMData MiningPredictive Analytics

Market Research in 3-D! – For Market Research, Social Networks Is to 2009 as what the Online Survey was in 1998

TomAnderson
TomAnderson
3 Min Read
Market Research in 3-D! - For Market Research, Social Networks Is to 2009 as what the Online Survey was in 1998
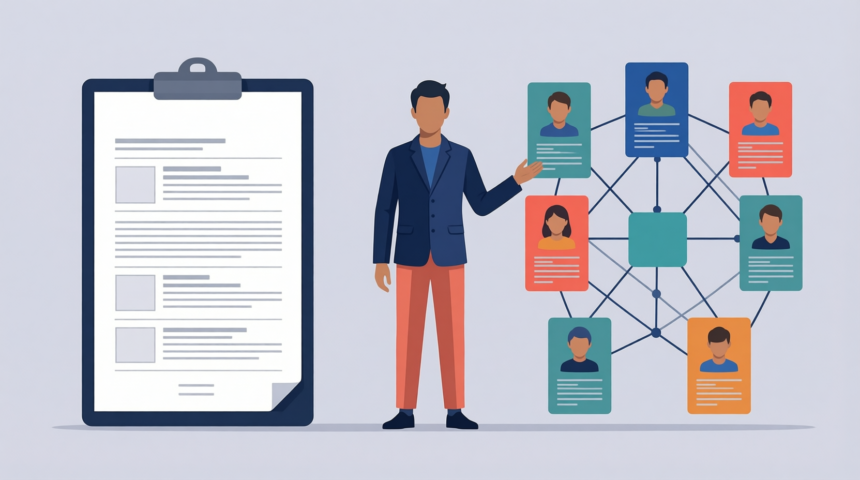
Illustration generated with Qwen Image.
SHARE

In the future I predict Social Network  Applications/Widgets could require Market Researchers to create entirely new sampling methods; creating a “cubed” or “Three-Dimensional” Sampling Plans.

The other day I was conducting cluster analysis on some of the most interesting data I’ve ever seen in my market research career! Big statement I know, especially considering the thousands of projects, surveys, clients I’ve worked for, and then more recently data Anderson Analytics has collected from the web by screen scraping and text mining consumer generated media.

What I was looking at last week was data from one of our social media applications/widgets on Facebook. There was data on over 45,000 users. However, I limited the clustering to the 3,200 or so recent active users. Then fed the segmentation analysis back into the application using discriminant analysis to create a typing tool.

What’s so fascinating to me is that this really allows for creating a cube of data. What people say about themselves as well as what their contacts say about them. It’s like 3-D Market Research!

More Read

5 Business Expenses That Data Can Help Reduce
Redefining Loyalty Programs with Big Data and Hadoop
4 Benefits of Big Data for Ecommerce Owners and Shoppers
Data Scientist Scarcity: Automation Is the Answer
How Data Analytics and BI Pros Used Twitter in August

Anyway, I was pressed for time, but still wanted to improve this app a little since it was covered in AdAge this past week. If you want to try it out and see which of the 6 segments you fall into you can go to the application here: http://www.facebook.com/apps/application.php?id=43439829009

You can also add a badge to your profile page showing how you score for each of the 6 dimensions and see which of your friends are similar to you. In my badge you can see that I’m most like the “Rock Star” segment, i.e. I have a rather healthy self image 😉  I am most different from the “Tough Times” segment which I assume also makes sense; after all I can’t very well lay myself off, LOL.

Anyway, I think leveraging social networks like this is the coolest thing to happen to market research since, I dunno, Al Gore invented the web. This may require us to think of entirely new sampling methodologies. Forget a random sample described as “n=3,000 US Rep”. In the future we may be talking about something more like “N=48,000 ~ n=3,000 Rep + n=45,000 of their first level (family, friends and colleague) connections”.
Tom

Link to original postTom H. C. Anderson – Anderson Analytics

Share This Article
Facebook Pinterest LinkedIn
Share

Follow us on Facebook

Latest News

Flat editorial illustration: The article contrasts tools for gathering fresh interviews with tools for analyzing existing qualita
10 AI Market Research Tools That Turn Qualitative Data into Insights
Artificial Intelligence Big Data Exclusive
Flat editorial illustration: The article compares proxy MCP servers by what an AI agent can do through them: manage proxy account
Proxy MCP Servers: 7 Options and What Each Lets an AI Agent Do
Artificial Intelligence Big Data Data Collection
Flat editorial illustration: The article is about joining public web signals with internal business metrics so BI teams can inter
Alternative Data in BI: Bringing Public Web Data Into Your Dashboards
Big Data Business Intelligence Exclusive Web Analytics
Flat editorial illustration: A SaaS-editorial scene showing product usage, support patterns, and renewal feedback informing a fle
Using Product Usage Analytics and Support Data to Build a B2B Product Roadmap
Business Intelligence Infographic

Stay Connected

1.2KFollowersLike
33.7KFollowersFollow
222FollowersPin

You Might also Like

Turn Analysis Into Action: 3 Tips
AnalyticsBest PracticesBig DataBusiness IntelligenceData Management

Turn Analysis Into Action: 3 Tips

5 Min Read
5 Unique Ways People Use Social Data In Their Business
Big DataBusiness IntelligenceExclusiveSocial Data

5 Unique Ways People Use Social Data In Their Business

6 Min Read
Update – Software AG
Business IntelligenceBusiness Rules

Update – Software AG

7 Min Read
smart crosswalk
Artificial IntelligenceExclusiveNews

AI Reduces Pedestrian Collisions With Smart Crosswalks

8 Min Read

SmartData Collective is one of the largest & trusted community covering technical content about Big Data, BI, Cloud, Analytics, Artificial Intelligence, IoT & more.

Chatbots and SEO: How Can Chatbots Improve Your SEO Ranking?
Artificial Intelligence Chatbots Exclusive
ai chatbot
How AI Website Chatbots Improve Customer Support and Lead Generation
Chatbots Exclusive

Quick Link

  • About
  • Contact
  • Privacy
Follow US
© 2008-26 SmartData Collective. All Rights Reserved.
Welcome Back!

Sign in to your account

Username or Email Address
Password

Lost your password?