We use cookies, including third-party cookies from Google to serve personalized ads through AdSense, to operate this site and understand how it is used. By continuing to browse, you accept this use. See our Privacy Policy and Terms of Use for details, including how to opt out of personalized advertising.
Accept
SmartData CollectiveSmartData Collective
  • Analytics
    AnalyticsShow More
    chatgpt image jul 21, 2026, 04 34 30 pm
    4 Core Benefits of Predictive Maintenance after Vibration Analysis
    10 Min Read
    How Does Data Mining Boost Customer Satisfaction in Logistics? Harnessing Analytics for Results -- AI-generated illustration
    How Does Data Mining Boost Customer Satisfaction in Logistics? Harnessing Analytics for Results
    11 Min Read
    chatgpt image jul 13, 2026, 04 23 45 pm
    How Data Analytics Helps Companies Improve User Engagement
    19 Min Read
    chatgpt image jul 13, 2026, 03 59 46 pm
    How Data Analytics Improves Multi-Location Search Strategies
    10 Min Read
    cybersecurity efforts
    How Behavioral Analytics and AI Are Redefining Cybersecurity for Boca Raton Businesses
    14 Min Read
  • Big Data
  • BI
  • Exclusive
  • IT
  • Marketing
  • Software
Search
© 2008-25 SmartData Collective. All Rights Reserved.
Reading: Eight Levels Of Analytics
Share
Notification
Font ResizerAa
SmartData CollectiveSmartData Collective
Font ResizerAa
Search
  • About
  • Help
  • Privacy
Follow US
© 2008-23 SmartData Collective. All Rights Reserved.
SmartData Collective > Business Intelligence > CRM > Eight Levels Of Analytics
CRMData MiningPredictive Analytics

Eight Levels Of Analytics

romakanta
romakanta
5 Min Read
Eight Levels Of Analytics
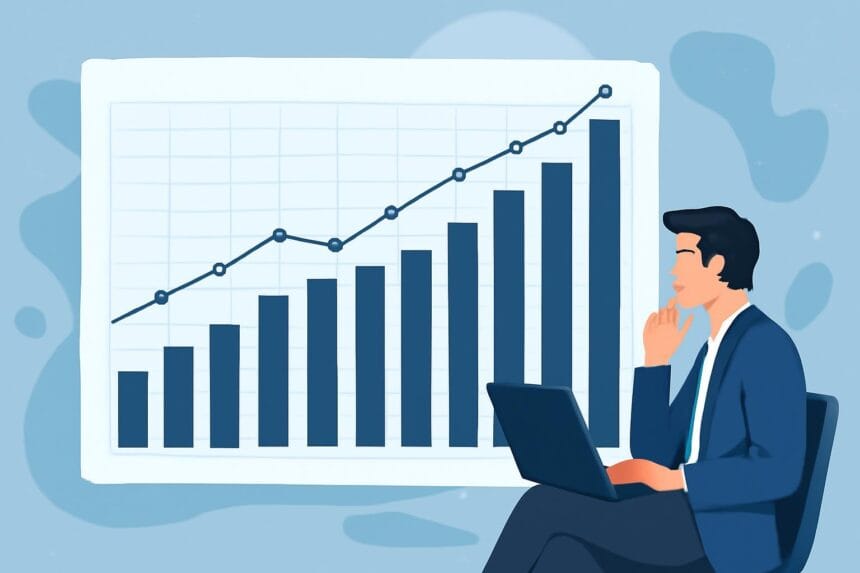
Illustrative image generated with OpenAI gpt-image-1.
SHARE

The number of companies advertising Analytics as one of their service offerings leaves me astounded. I also come across an endless number of people who say they are into Analytics.

Maybe all this has to do with the very broad definition of Analytics. Or the way some people/companies interpret Analytics. A little more research, and a few more minutes of conversation reveals that the “Analytics” these companies or people actually do is just reporting. Personally speaking, I feel “Analytics” has become a widely misinterpreted and misused term.

According to Gartner, “Analytics leverage data in a particular functional process (or application) to enable context-specific insight that is actionable.”

The latest sascom online magazine describes the eight levels of Analytics, from the simplest to the most advanced.

More Read

A Swarm of Nano Quadrotors: The flying robot video you absolutely must watch
Three Competencies for the Entity Web
Social Media Data and what analysts can do with it
The Scourge of Data Silos
PASW 13 :The preview
1. STANDARD REPORTS
What happened? When did it happen?
E.g. Monthly or quarterly financial reports.
Generated on a regular basis, they just describe “what happened” in a particular area. They’re useful to some extent, but not for making long-term decisions.
2. AD HOC REPORTS
How many? How often? Where?
E.g. Custom reports that describe the number of hospital patients for every diagnosis code for each day of the week.
At their best, ad hoc reports let you ask the questions and request a couple of custom reports to find the answers.
3. QUERY DRILLDOWN (OR OLAP)
Where exactly is the problem? How do I find the answers?
E.g. Sort and explore data about different types of cell phone users and their calling behaviors.
Query drilldown allows for a little bit of discovery. OLAP lets you manipulate the data yourself to find out how many, what color and where.
4. ALERTS
When should I react? What actions are needed now?
E.g. Sales executives receive alerts when sales targets are falling behind.
With alerts, you can learn when you have a problem and be notified when something similar happens again in the future. Alerts can appear via e-mail, RSS feeds or as red dials on a scorecard or dashboard.

5. STATISTICAL ANALYSIS
Why is this happening? What opportunities am I missing?
E.g. Banks can discover why an increasing number of customers are refinancing their homes. 
Here we can begin to run some complex analytics, like frequency models and regression analysis. We can begin to look at why things are happening using the stored data and then begin to answer questions based on the data.
6. FORECASTING
What if these trends continue? How much is needed? When will it be needed?
E.g. Retailers can predict how demand for individual products will vary from store to store.
Forecasting is one of the hottest markets – and hottest analytical applications – right now. It applies everywhere. In particular, forecasting demand helps supply just enough inventory, so you don’t run out or have too much.
7. PREDICTIVE MODELING
What will happen next? How will it affect my business?
E.g. Hotels and casinos can predict which VIP customers will be more interested in particular vacation packages.
If you have 10 million customers and want to do a marketing campaign, who’s most likely to respond? How do you segment that group? And how do you determine who’s most likely to leave your organization? Predictive modeling provides the answers.
8. OPTIMIZATION
How do we do things better? What is the best decision for a complex problem?
E.g. Given business priorities, resource constraints and available technology, determine the best way to optimize your IT platform to satisfy the needs of every user.
Optimization supports innovation. It takes your resources and needs into consideration and helps you find the best possible way to accomplish your goals.

Share This Article
Facebook Pinterest LinkedIn
Share

Follow us on Facebook

Latest News

Stellar Repair for MS SQL Review: Can It Repair SQL Databases? -- AI-generated illustration
Stellar Repair for MS SQL Review: Can It Repair SQL Databases?
Exclusive Software SQL
How Search Engine Indexing Lags Behind Large-Scale Website Domain Migrations -- AI-generated illustration
How Search Engine Indexing Lags Behind Large-Scale Website Domain Migrations
News
How Great Content Moves Through A Marketing Ecosystem -- AI-generated illustration
How Great Content Moves Through A Marketing Ecosystem
Exclusive Infographic Marketing
What Your Brand Misses That Data Reveals -- AI-generated illustration
What Your Brand Misses That Data Reveals
Big Data Exclusive Infographic

Stay Connected

1.2KFollowersLike
33.7KFollowersFollow
222FollowersPin

You Might also Like

IBM’s Watson: Becoming a Doctor with Data Analytics
Data MiningData Quality

IBM’s Watson: Becoming a Doctor with Data Analytics

4 Min Read
Predictive Analysis: Toys that Rock for the Holidays
Predictive Analytics

Predictive Analysis: Toys that Rock for the Holidays

4 Min Read
#14: Here's a thought...
Business IntelligenceData MiningData VisualizationData Warehousing

#14: Here’s a thought…

6 Min Read
Analytics is the sophisticated analysis and use of business data...
Business IntelligenceData MiningData WarehousingPredictive Analytics

Analytics is the sophisticated analysis and use of business data…

1 Min Read

SmartData Collective is one of the largest & trusted community covering technical content about Big Data, BI, Cloud, Analytics, Artificial Intelligence, IoT & more.

How To Get An Award Winning Giveaway Bot
Big Data Chatbots Exclusive
The Art of Conversation: Enhancing Chatbots with Advanced AI Prompts
Chatbots

Quick Link

  • About
  • Contact
  • Privacy
Follow US
© 2008-26 SmartData Collective. All Rights Reserved.
Welcome Back!

Sign in to your account

Username or Email Address
Password

Lost your password?