
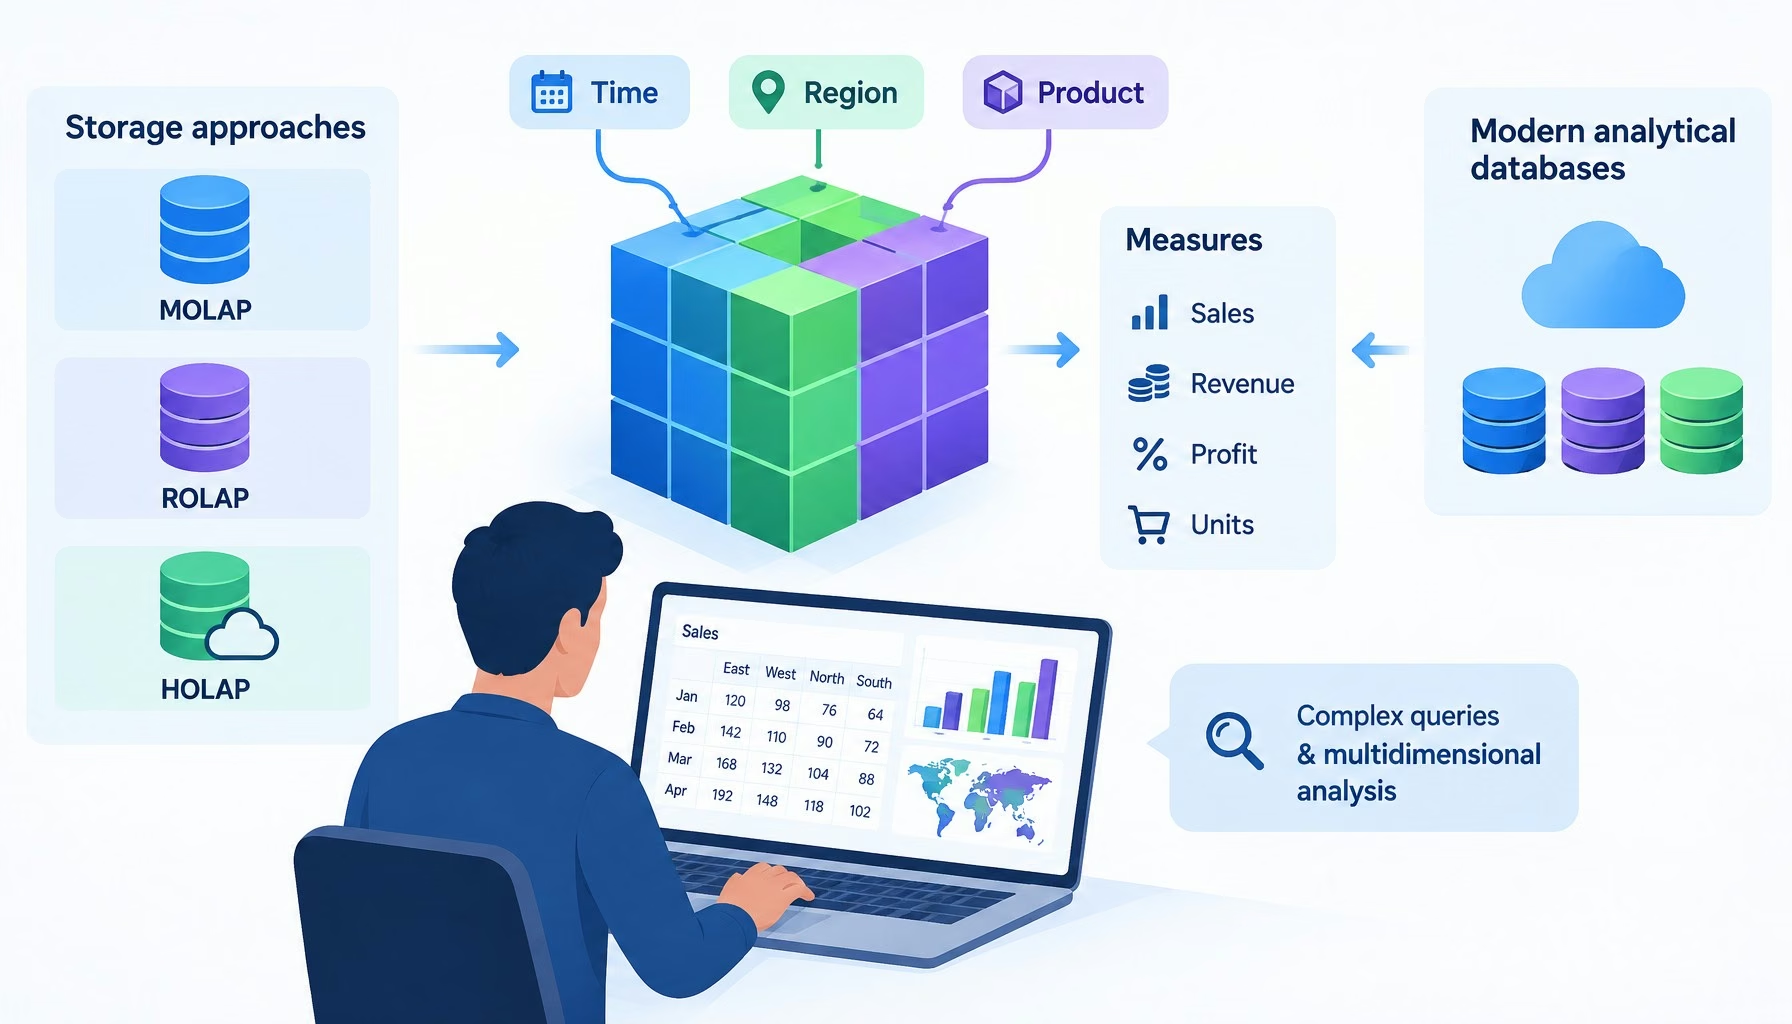
Choosing OLAP tools starts with the questions your analysts need to answer. Storage architecture, analytical models and deployment options are separate decisions. Comparing them separately helps prevent a product’s familiar “OLAP” label from standing in for a clear account of how it will handle your workload.
OLAP tools support complex queries and multidimensional analysis across large datasets. They help users examine measures such as sales across dimensions such as time and region. Storage and execution choices vary, so selection should reflect the workload.
- Separate storage from model design.
- Check execution and deployment options.
- Test representative analytical questions.
Storage approaches: MOLAP, ROLAP and HOLAP
MOLAP uses multidimensional cube storage. ROLAP analyzes relational tables without first reorganizing them into a cube. HOLAP combines relational and multidimensional approaches. IBM explains these storage approaches; the distinction concerns how analytical data is organized, not which interface an analyst sees.
What OLAP tools do
IBM describes OLAP as supporting complex, multidimensional queries over large repositories. Reorganizing data from multiple relational datasets into a multidimensional format lets users explore it from different perspectives. For another introductory resource, see more.
Working with dimensions and measures
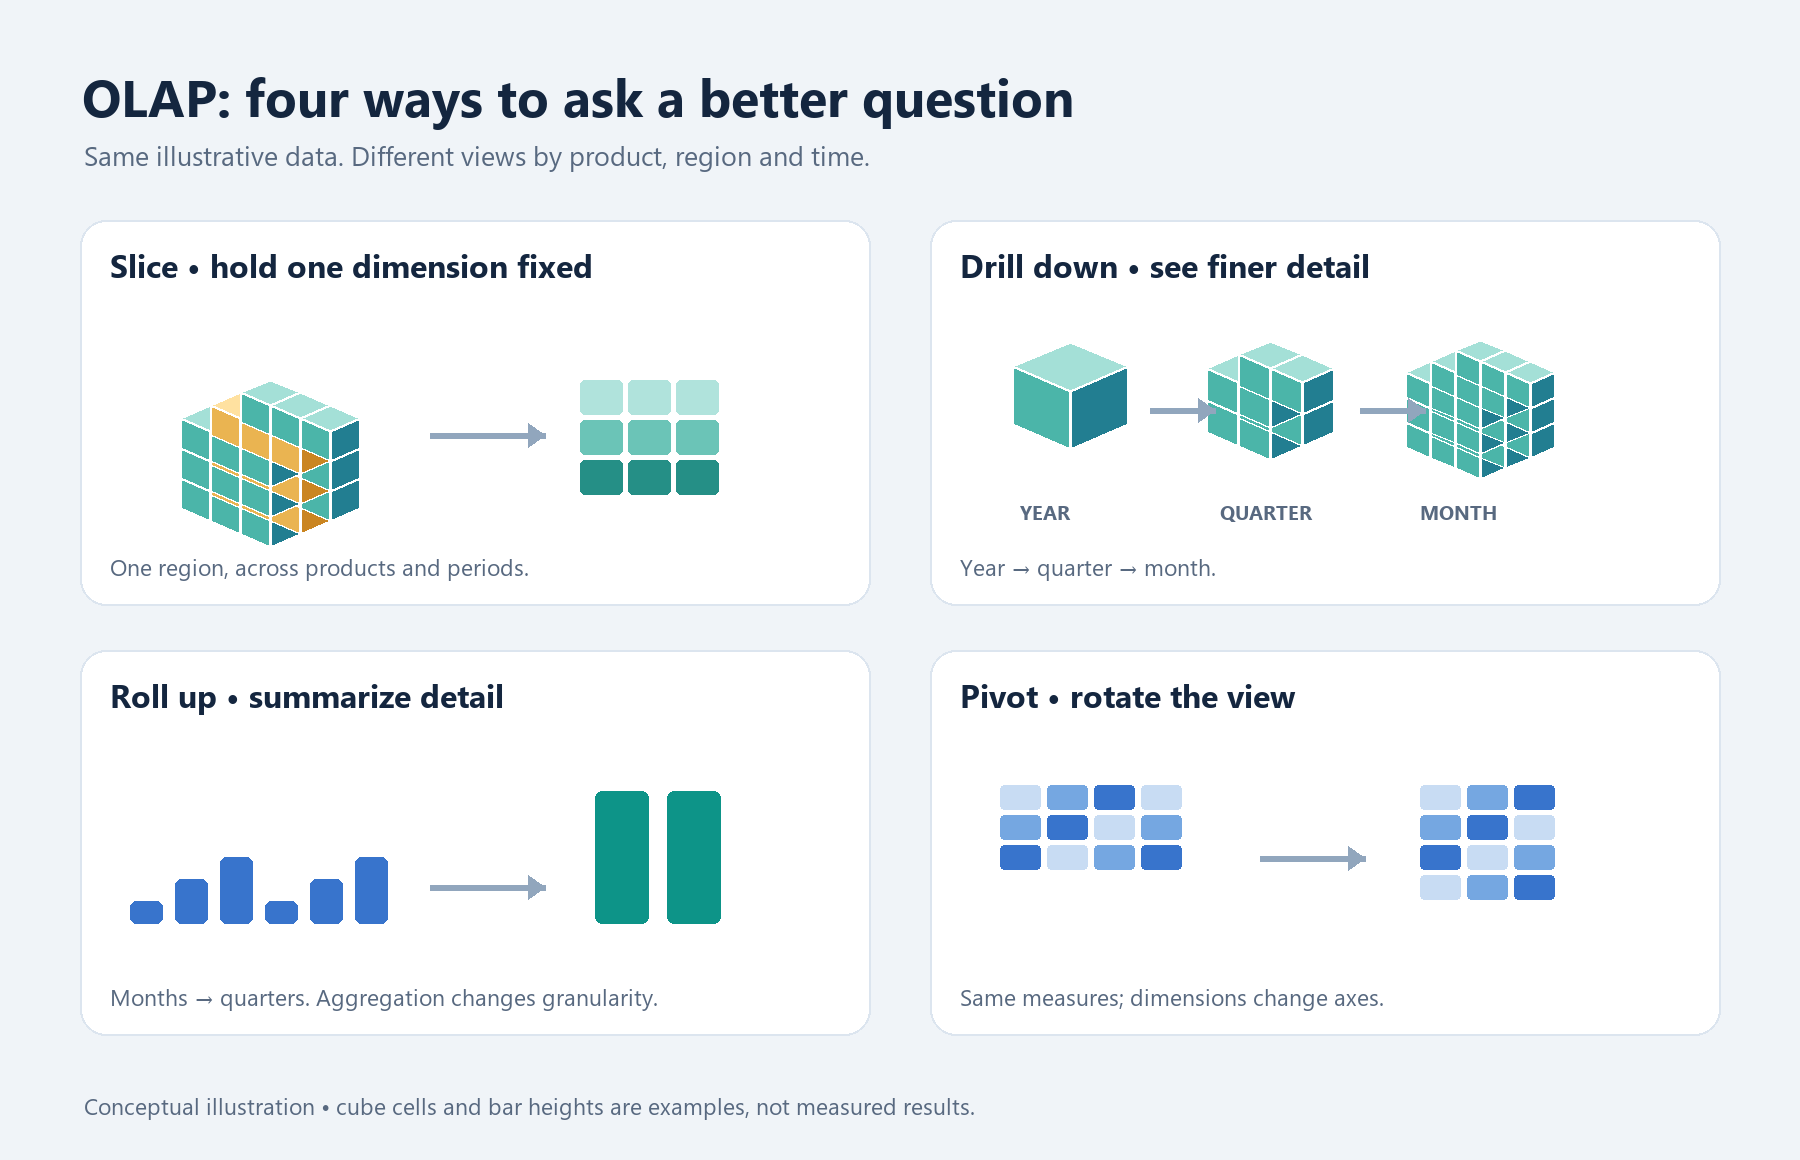
Measures are quantities being analyzed; dimensions organize them. In an illustrative sales model, revenue is a measure and region a dimension. Roll-up aggregates data higher in a hierarchy or across fewer dimensions. Slicing selects one dimension to create a smaller analytical view.
Cube and tabular model choices
Storage terminology doesn’t fully describe the model a team will build. Microsoft provides a concrete example: its Analysis Services Multidimensional and Data Mining mode supports traditional OLAP and data mining. Its separate tabular models support in-memory or DirectQuery execution.
A relationship in a Tabular model connects two tables only using one column as an identifier.
Marco Russo, in his 2020 technical articleThat makes “Does it support OLAP?” an incomplete purchasing question. A proposed tabular solution still needs an execution choice. A proposal built around a traditional multidimensional model should identify that model explicitly. Neither label supplies a workload-specific performance result.
For an evaluation, give each candidate the same analytical task. An illustrative task might require regional revenue totals, a monthly breakdown and a correction to an underlying sales record. Have the team demonstrate the calculations and explain how the correction reaches the result. This is a proposed test, not a claim that either model will finish faster.
Modern analytical databases
OLAP also describes workloads served by analytical databases. The Apache Druid documentation describes Druid as a real-time analytics database designed for OLAP queries over large datasets. That establishes its intended use, but it doesn’t establish a response-time or freshness guarantee for a particular deployment.

Data layout introduces another decision. ClickHouse explains that column-oriented storage makes filters and aggregation much faster than row-oriented storage, while making individual rows harder to reconstruct because their values are separated. This is a documented architectural tradeoff, not a benchmark against every competing database.
A useful trial would therefore include both the summary query and any individual-record retrieval the application needs. For example, a hypothetical dashboard might show a regional total and let a user inspect a contributing transaction. Measuring only the total would leave the second interaction untested.
Keep query design in that evaluation. Smart Data Collective’s article on handing SQL queries provides related reading. Record the queries used in a trial so a change in query formulation isn’t mistaken for a difference between storage architectures.
Choosing a tool and deployment model
Microsoft’s tabular documentation lists deployment targets including Power BI Premium, Azure Analysis Services and SQL Server Analysis Services configured for Tabular server mode. These are destinations for that model family, not a universal list of OLAP deployment options.
Use the documented distinctions to structure a shortlist. The table identifies questions to resolve; it doesn’t rank products or assign unsupported scores.
| Decision criterion | Supported distinction | Question for evaluation |
|---|---|---|
| Analytical model | Microsoft documents multidimensional and tabular models. | Which model does the proposed solution require? |
| Tabular execution | In-memory and DirectQuery are documented options. | Which mode will the demonstration use? |
| Database layout | ClickHouse describes column-level filtering and aggregation benefits alongside row-reconstruction difficulty. | Does the trial include both summaries and record retrieval? |
| Deployment | Microsoft lists specific hosting targets for tabular models. | Which target is included in the proposal? |
Include staffing and maintenance in the discussion without substituting general industry statistics for your team’s requirements. A historical data-science staffing report, linked here, discusses resourcing; it should not be read as a current OLAP adoption figure. Earlier coverage of drawbacks of using OLAP can supply discussion prompts, but candidate-specific limitations need candidate-specific evidence.
Frequently Asked Questions
Do tabular models always run in memory?
No. Microsoft documents both in-memory and DirectQuery execution for Analysis Services tabular models. Confirm which mode a proposed implementation uses.
Does column-oriented storage make every query faster?
No universal conclusion follows. ClickHouse’s explanation identifies advantages for filtering and aggregation, while noting greater difficulty reconstructing individual rows. Test the operations your application actually performs.
Build the shortlist around one real report
Choose an existing report and document its required calculations, data freshness and acceptable response time. Then ask each shortlisted provider to demonstrate that report under the proposed model, execution mode and deployment. Keep the query results and configuration together so the eventual choice rests on a reproducible comparison.