We use cookies, including third-party cookies from Google to serve personalized ads through AdSense, to operate this site and understand how it is used. By continuing to browse, you accept this use. See our Privacy Policy and Terms of Use for details, including how to opt out of personalized advertising.
Accept
SmartData CollectiveSmartData Collective
  • Analytics
    AnalyticsShow More
    chatgpt image jul 21, 2026, 04 34 30 pm
    4 Core Benefits of Predictive Maintenance after Vibration Analysis
    10 Min Read
    How Does Data Mining Boost Customer Satisfaction in Logistics? Harnessing Analytics for Results -- AI-generated illustration
    How Does Data Mining Boost Customer Satisfaction in Logistics? Harnessing Analytics for Results
    11 Min Read
    chatgpt image jul 13, 2026, 04 23 45 pm
    How Data Analytics Helps Companies Improve User Engagement
    19 Min Read
    chatgpt image jul 13, 2026, 03 59 46 pm
    How Data Analytics Improves Multi-Location Search Strategies
    10 Min Read
    cybersecurity efforts
    How Behavioral Analytics and AI Are Redefining Cybersecurity for Boca Raton Businesses
    14 Min Read
  • Big Data
  • BI
  • Exclusive
  • IT
  • Marketing
  • Software
Search
© 2008-25 SmartData Collective. All Rights Reserved.
Reading: Data Visualization: Making Big Data Dance
Share
Notification
Font ResizerAa
SmartData CollectiveSmartData Collective
Font ResizerAa
Search
  • About
  • Help
  • Privacy
Follow US
© 2008-23 SmartData Collective. All Rights Reserved.
SmartData Collective > Big Data > Data Visualization > Data Visualization: Making Big Data Dance
Big DataBusiness IntelligenceData Visualization

Data Visualization: Making Big Data Dance

MIKE20
MIKE20
4 Min Read
Data Visualization: Making Big Data Dance
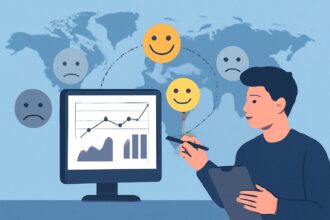
Illustration generated with FLUX.2 [klein 4B] via Cloudflare Workers AI.
SHARE

Fifteen years ago, the presentation of data typically fell under the purview of analysts and IT professionals. Quarterly or annual meetings entailed rolling data up into now quaint diagrams, graphs, and charts.

Contents
  • Big Data: Enterprise Shifts
  • Simon Says: Make the Data Dance
  • Feedback

My, how times have changed. Today, data is everywhere. We have entered the era of Big Data and, as I write in Too Big to Ignore, many things are changing.

Fifteen years ago, the presentation of data typically fell under the purview of analysts and IT professionals. Quarterly or annual meetings entailed rolling data up into now quaint diagrams, graphs, and charts.

My, how times have changed. Today, data is everywhere. We have entered the era of Big Data and, as I write in Too Big to Ignore, many things are changing.

More Read

Information Builders Releases 7.7 Keysheet Quick Reference Guides
Decision Management and In-Memory Technology
Who I Want at the Business Intelligence Table
C and C++ Are Surprisingly Useful for Data Science Applications
The Promise and Challenge of Using Big Data to Address World Problems

Big Data: Enterprise Shifts

In the workplace, let’s focus on two major shifts. First, today it’s becoming incumbent upon just about every member of a team, group, department, and organization to effectively present data in a compelling manner. Hidden in the petabytes of structured and unstructured data are key consumer, employee, and organizational insights that, if unleashed, would invariably move the needle.

Second, data no longer needs be presented on an occasional or periodic basis. Many employees are routinely looking at data of all types, a trend that will only intensify in the coming years.

The proliferation of effective data visualization tools like Ease.ly and Tableau provides tremendous opportunity. (The latter just went public with the übercool stock symbol $DATA.) Sadly, though, not enough employees—and, by extension, organizations—maximize the massive opportunity presented by data visualization. Of course, notable exceptions exist, but far too many professionals ignore DV tools. The result: they fail to present data in visually compelling ways. Far too many of us rely upon old standbys: bar charts, simple graphs, and the ubiquitous Excel spreadsheet. One of the biggest challenges to date with Big Data: Getting more people actually use the data–and the tools that make that data dance.

This begs the question: Why the lack of adoption? I’d posit that two factors are at play here:

  • Lack of knowledge that such tools exist among end users.
  • Many end users who know of these tools are unwilling to use them.

Simon Says: Make the Data Dance

Big Data in and of itself guarantees nothing. Presenting findings to senior management should involve more than pouring over thousands of records. Yes, the ability to drill down is essential. But starting with a compelling visual represents a strong start in gaining their attention.

Big Data is impossible to leverage with traditional tools (read: relational databases, SQL statements, Excel spreadsheets, and the like.)  Fortunately, increasingly powerful tools allow us to interpret and act upon previously unimaginable amounts of data. But we have to decide to use them.

Feedback

What say you?

Share This Article
Facebook Pinterest LinkedIn
Share

Follow us on Facebook

Latest News

How Search Engine Indexing Lags Behind Large-Scale Website Domain Migrations -- AI-generated illustration
How Search Engine Indexing Lags Behind Large-Scale Website Domain Migrations
News
How Great Content Moves Through A Marketing Ecosystem -- AI-generated illustration
How Great Content Moves Through A Marketing Ecosystem
Exclusive Infographic Marketing
What Your Brand Misses That Data Reveals -- AI-generated illustration
What Your Brand Misses That Data Reveals
Big Data Exclusive Infographic
5 Common Mistakes Businesses Make During the Risk Assessment Process -- AI-generated illustration
5 Common Mistakes Businesses Make During the Risk Assessment Process
Business Intelligence Exclusive Risk Management

Stay Connected

1.2KFollowersLike
33.7KFollowersFollow
222FollowersPin

You Might also Like

Cloud-Based Data
Big DataCloud ComputingIT

Cloud-Based Data is Optimizing Every Aspect of the Modern Startup

6 Min Read

Obstacles to Personal Genetic Testing in the U.S. and Abroad

5 Min Read
Looking at dashboards and ROI
Business Intelligence

Looking at dashboards and ROI

1 Min Read
Image
Big DataData MiningSocial Data

Data Philanthropy and Mutual Benefits of the Spirit of Giving

11 Min Read

SmartData Collective is one of the largest & trusted community covering technical content about Big Data, BI, Cloud, Analytics, Artificial Intelligence, IoT & more.

ai chatbot
How AI Website Chatbots Improve Customer Support and Lead Generation
Chatbots Exclusive
From Bolts to Bots: How AI Is Fortifying the Automotive Industry
Artificial Intelligence

Quick Link

  • About
  • Contact
  • Privacy
Follow US
© 2008-26 SmartData Collective. All Rights Reserved.
Welcome Back!

Sign in to your account

Username or Email Address
Password

Lost your password?