We use cookies, including third-party cookies from Google to serve personalized ads through AdSense, to operate this site and understand how it is used. By continuing to browse, you accept this use. See our Privacy Policy and Terms of Use for details, including how to opt out of personalized advertising.
Accept
SmartData CollectiveSmartData Collective
  • Analytics
    AnalyticsShow More
    chatgpt image jul 21, 2026, 04 34 30 pm
    4 Core Benefits of Predictive Maintenance after Vibration Analysis
    10 Min Read
    How Does Data Mining Boost Customer Satisfaction in Logistics? Harnessing Analytics for Results -- AI-generated illustration
    How Does Data Mining Boost Customer Satisfaction in Logistics? Harnessing Analytics for Results
    11 Min Read
    chatgpt image jul 13, 2026, 04 23 45 pm
    How Data Analytics Helps Companies Improve User Engagement
    19 Min Read
    chatgpt image jul 13, 2026, 03 59 46 pm
    How Data Analytics Improves Multi-Location Search Strategies
    10 Min Read
    cybersecurity efforts
    How Behavioral Analytics and AI Are Redefining Cybersecurity for Boca Raton Businesses
    14 Min Read
  • Big Data
  • BI
  • Exclusive
  • IT
  • Marketing
  • Software
Search
© 2008-25 SmartData Collective. All Rights Reserved.
Reading: Integrating Big Data and More with Your Data Warehouse
Share
Notification
Font ResizerAa
SmartData CollectiveSmartData Collective
Font ResizerAa
Search
  • About
  • Help
  • Privacy
Follow US
© 2008-23 SmartData Collective. All Rights Reserved.
SmartData Collective > Data Management > Best Practices > Integrating Big Data and More with Your Data Warehouse
Best PracticesBusiness Intelligence

Integrating Big Data and More with Your Data Warehouse

Barry Devlin
Barry Devlin
4 Min Read
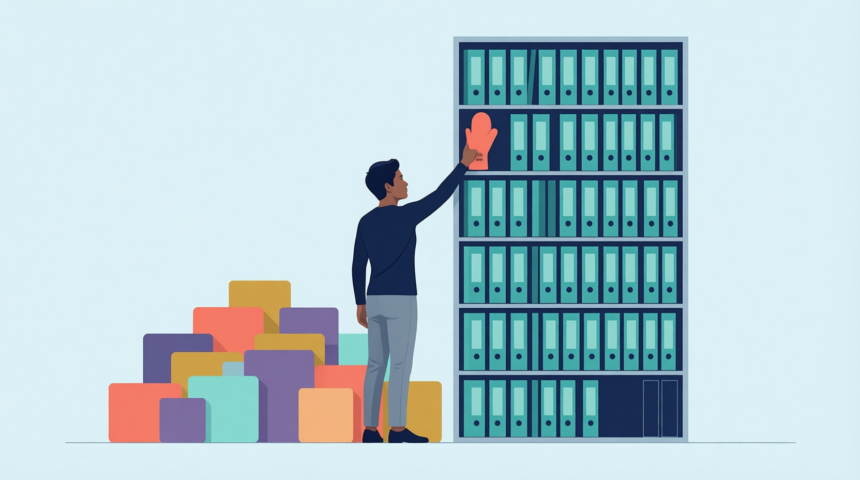
Integrating Big Data and More with Your Data Warehouse
Illustration generated with Qwen Image.
SHARE


In 1988 I 
published the first data warehouse architecture.  Its aim was to provide consistent, integrated data to business users in support of cross-enterprise decision making.  Quality and consistency were the key drivers; at that time the major issues were that operational / transactional systems were highly inconsistent and direct access to them was discouraged for reasons of performance and security.  Business users were happy to get whatever consistent view they could, and, in general, wanted to see a stable representation of the business on a monthly, weekly or occasionally daily basis.  This architecture has remained a foundation of business intelligence ever since.

21 years later, in 2009, I introduced Business Integrated Insight (BI2).  With emerging needs like near real-time decision making in operational BI and increasing use of non-traditional data coming from Web 2.0 and other sources, this new architecture had to address a far wider scope than the original data warehouse.  While consistency and integrity remain important considerations, today’s business needs are far more about instant access to the ever-changing ebb and flow of trends in sales, manufacturing and more.  It was becoming clear that a new, over-arching architecture was required to cover all the information, processes and people of the business.

Now, three years later, it’s clear that traditional BI is racing to keep up with developments in big data, data virtualization and the cloud, mobile computing as well as social networking and collaboration.  All these topics were incorporated in BI2 from the outset.  Now, as the technology moves to the mainstream, we can and must to dive deeper in these specific areas.  Big data leads clearly to the impossibility of routing all information through an enterprise data warehouse (EDW).  But, how will that impact our need for consistency and integrity?  I envisage we will move from the old adage of “a single version of the truth” to multiple versions depending on users’ needs, with one particular version that I call core “business information” being the source of truth for external reporting and financial governance needs.  
More Read

Join the real movers and shakers in Washington!
What is the Future of Business Intelligence in the Coming Year?
Measuring the benefits of Business Intelligence
Amazing Ways AI is Changing the Marketing Landscape
Business Analytics & Optimization Leaders

Data virtualization has also become big news in recent years.  In many ways, it’s a technology whose time has come.  With the explosion of data volumes and varieties, users need ways to combine data on the fly with confidence and performance.  Data virtualization addresses these needs and is increasingly overlapping with function we traditionally associate with ETL.  The result, data integration, as it’s sometimes called, enables us to envisage a future where data is made available to users as they need it, whether real-time or integrated and historicized.  

And, against the background of all this upheaval in data and infrastructure, we also see a new breed of technology-savvy business users moving into positions of power.  These so-called millennials are demanding seamless, mobile access to the information they need, as well as the ability to play with it as required.  The rule of IT over the data and application resources of the organization is coming to an end.  But, that’s not to say that IT has no future role.  In fact, I see more of a fully symbiotic partnership between business and IT emerging, a partnership I call the “biz-tech ecosystem”.

My 2012 BI2 Seminar in Rome on 11-12 June explores these new directions and provides guidance on their introduction in your existing data warehouse environment.  It also introduces the Advanced Information Warehouse, shown above, as the next step on your journey from a traditional data warehouse to comprehensive business integrated insight.

Share This Article
Facebook Pinterest LinkedIn
Share

Follow us on Facebook

Latest News

Illustration of mobile analytics dashboards with ad performance charts connected to backend databases
11 Best Sisense Alternatives for Embedded Analytics
Business Intelligence Exclusive
Analyst points at colorful circular data dashboard on screen - information technology business metrics
How Fragmented Workplace Tech Undermines Reliable Business Metrics and Reporting
Cloud Computing Exclusive Infographic IT
Using Multi-Source Data and Analytics to Detect Operational Drift Across Franchise Networks -- AI-generated illustration
Using Multi-Source Data and Analytics to Detect Operational Drift Across Franchise Networks
Exclusive Infographic
Beyond The First Impression: The Long-Lasting Impact Of Sensory Marketing -- AI-generated illustration
Beyond The First Impression: The Long-Lasting Impact Of Sensory Marketing
Infographic Marketing

Stay Connected

1.2KFollowersLike
33.7KFollowersFollow
222FollowersPin

You Might also Like

5 Sure-Fire Tips How AI Is Going to Improve Fintech in 2021
Fintech

5 Sure-Fire Tips How AI Is Going to Improve Fintech in 2021

5 Min Read
AI Drives Breakthroughs in Therapy Practice Management Software
Artificial Intelligence

AI Drives Breakthroughs in Therapy Practice Management Software

12 Min Read
Self Service BI, Dead or Alive?
AnalyticsBusiness Intelligence

Self Service BI, Dead or Alive?

6 Min Read
Looking for Kool-Aid at the Tableau conference
Business IntelligenceData Visualization

Looking for Kool-Aid at the Tableau conference

7 Min Read

SmartData Collective is one of the largest & trusted community covering technical content about Big Data, BI, Cloud, Analytics, Artificial Intelligence, IoT & more.

From Bolts to Bots: How AI Is Fortifying the Automotive Industry
Artificial Intelligence
AI chatbots
AI Chatbots Can Help Retailers Convert Live Broadcast Viewers into Sales!
Chatbots

Quick Link

  • About
  • Contact
  • Privacy
Follow US
© 2008-26 SmartData Collective. All Rights Reserved.
Welcome Back!

Sign in to your account

Username or Email Address
Password

Lost your password?