
We use cookies, including third-party cookies from Google to serve personalized ads through AdSense, to operate this site and understand how it is used. By continuing to browse, you accept this use. See our Privacy Policy and Terms of Use for details, including how to opt out of personalized advertising.
Accept
SmartData CollectiveSmartData Collective
  • Analytics
    AnalyticsShow More
    What Kind of Problem-Solving Distinguishes Data Analysts From Software Engineers -- AI-generated illustration
    What Kind of Problem-Solving Distinguishes Data Analysts From Software Engineers
    7 Min Read
    chatgpt image jul 21, 2026, 04 34 30 pm
    4 Core Benefits of Predictive Maintenance after Vibration Analysis
    10 Min Read
    How Does Data Mining Boost Customer Satisfaction in Logistics? Harnessing Analytics for Results -- AI-generated illustration
    How Does Data Mining Boost Customer Satisfaction in Logistics? Harnessing Analytics for Results
    11 Min Read
    chatgpt image jul 13, 2026, 04 23 45 pm
    How Data Analytics Helps Companies Improve User Engagement
    19 Min Read
    chatgpt image jul 13, 2026, 03 59 46 pm
    How Data Analytics Improves Multi-Location Search Strategies
    10 Min Read
  • Big Data
  • BI
  • Exclusive
  • IT
  • Marketing
  • Software
Search
© 2008-25 SmartData Collective. All Rights Reserved.
Reading: Mardi Gras in November
Share
Notification
Font ResizerAa
SmartData CollectiveSmartData Collective
Font ResizerAa
Search
  • About
  • Help
  • Privacy
Follow US
© 2008-23 SmartData Collective. All Rights Reserved.
SmartData Collective > Business Intelligence > Mardi Gras in November
Business Intelligence

Mardi Gras in November

LyndsayWise
LyndsayWise
2 Min Read
Mardi Gras in November
Illustration generated with FLUX.2 [klein 4B] via Cloudflare Workers AI.
SHARE

I spent most of last week at TDWI in New Orleans.  Although I didn’t get much of an opportunity to attend the classes, meeting with vendors and getting the scoop on what different solution providers are doing always helps give me additional insights into the market in general.  With the ability to meet with many people and discuss what is going on in the market within a condensed amount of time, it becomes possible to identify some similarities or disparities within the industry at large.

One interesting thing to note is the seeming gaps between what offerings exist and what companies are actually doing.  Aside from the fact that BI is only now becoming user friendly and more available to business users, the reality exists that the pace of development is growing with technological advancements and organizations aren’t necessarily following suit.  This type of trend has occured in the past with technology being able to accomodate forms of unstructured data and the like, but with organizations not being ready to take advantage of the technology.  It remains to be seen if the same will occur with todays technology.  Hopefully, the Internet and use of Web 2.0 will help propel organizations to the next level of technology use that extends beyond BI.

Share This Article
Facebook Pinterest LinkedIn
Share

Follow us on Facebook

Latest News

Flat editorial illustration: The article’s core relationship is between growing compute density and adaptable rack hardware that
6 Details That Make a Data Centre’s Server Room Easier to Scale
Best Practices Data Management Exclusive IT
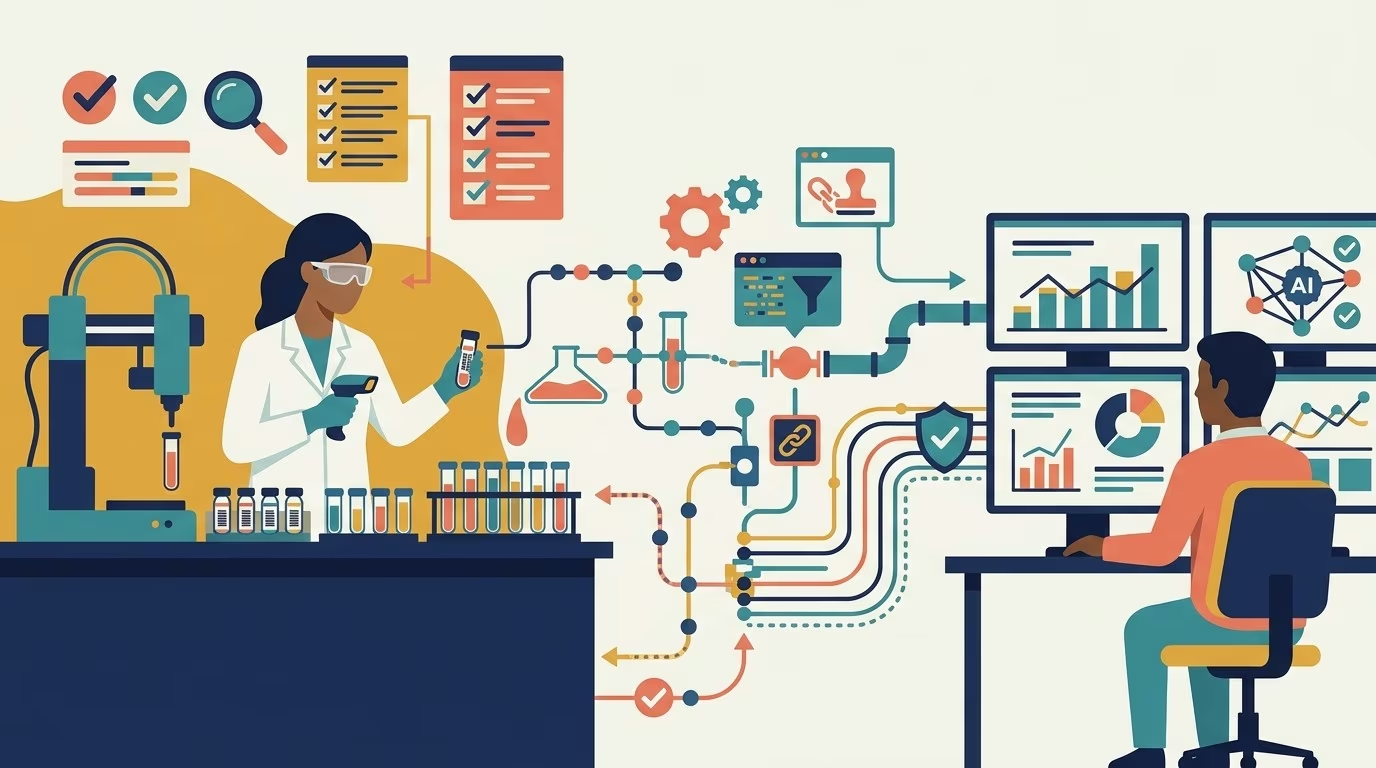
Flat editorial illustration: The article’s core relationship is a transfer of discipline from regulated laboratories to analytics
What Business Intelligence Teams Can Learn from Lab Data Governance
Business Intelligence Exclusive
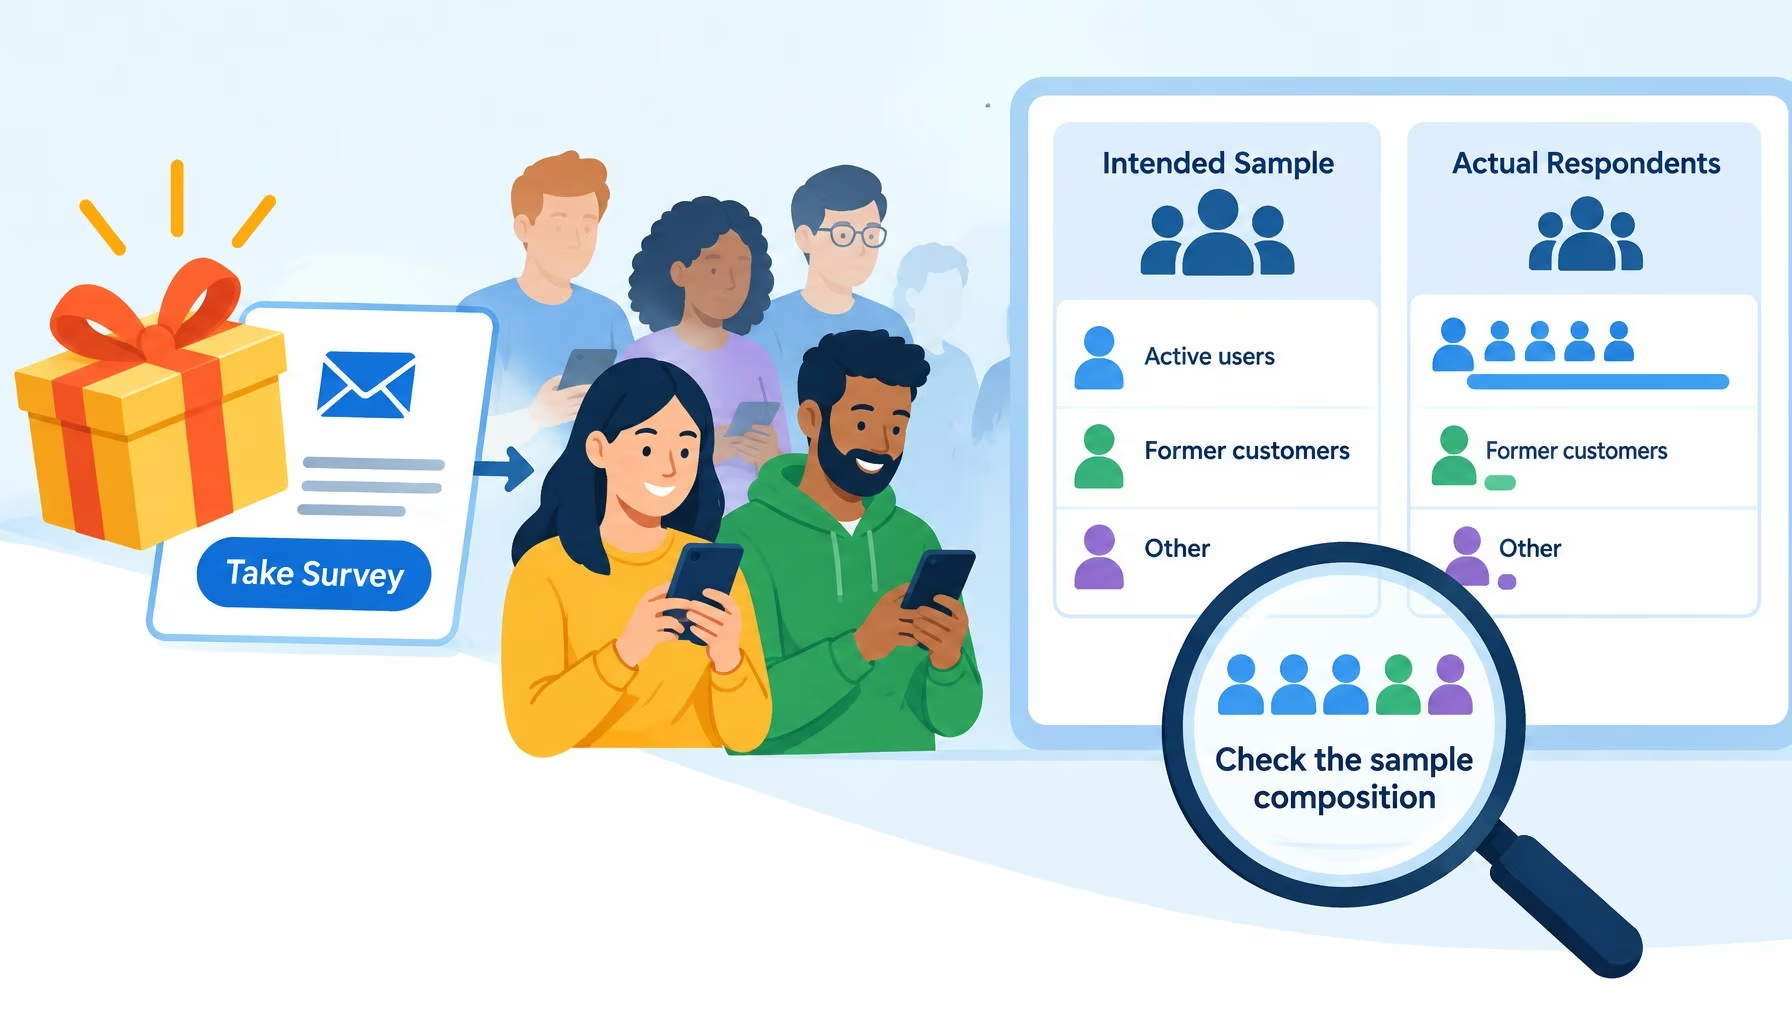
Flat editorial illustration: A guaranteed reward can raise participation while skewing the respondent pool toward active customer
Incentive-Driven Response Bias: Auditing Sample Composition Before You Trust Survey Data
Big Data Data Quality Exclusive
Flat editorial illustration: The article’s core relationship is observable blockchain activity becoming a trustworthy business me
Blockchain Dashboards Need Better Definitions, Not More Charts
Blockchain Exclusive

Stay Connected

1.2KFollowersLike
33.7KFollowersFollow
222FollowersPin

You Might also Like

How to Build a Roadmap: Gap Analysis
AnalyticsBest PracticesBusiness IntelligenceCulture/LeadershipData Management

How to Build a Roadmap: Gap Analysis

15 Min Read
Reducing the Confusion about Performance Management
Business IntelligenceCRMPredictive Analytics

Reducing the Confusion about Performance Management

4 Min Read
Text Analytics Pros Daily
Business Intelligence

Text Analytics Pros Daily

2 Min Read
Be the Best - 9 Ways to Market Your Business with Big Data
Big Data

Be the Best – 9 Ways to Market Your Business with Big Data

11 Min Read

SmartData Collective is one of the largest & trusted community covering technical content about Big Data, BI, Cloud, Analytics, Artificial Intelligence, IoT & more.

5 Great Tips for Using Data Analytics for Website UX
Big Data
Artificial Intelligence for eCommerce: A Closer Look
Artificial Intelligence

Quick Link

  • About
  • Contact
  • Privacy
Follow US
© 2008-26 SmartData Collective. All Rights Reserved.
Welcome Back!

Sign in to your account

Username or Email Address
Password

Lost your password?