A dashboard shows rising transaction volume, more active addresses, and a growing number of transfers. The charts look encouraging. Yet those movements could reflect customer activity, internal wallet transfers, automated processes, or a change in how the data was collected. The numbers alone cannot settle the question.
- Define the Business Event Before Counting It
- Connect On-Chain Records With Off-Chain Context
- Preserve Timing and Data Provenance
- Test the Interpretation Alongside the Pipeline
- FAQ
- How to trace a blockchain transaction?
- Why are blockchain dashboards misleading?
- How to define business events for blockchain data?
- How to preserve data provenance in blockchain analytics?
- Check the Event Definition Before Adding Another Chart
Trustworthy blockchain dashboards connect observable activity to defined business events. Specify what qualifies for each metric, exclude internal movements where appropriate, and connect transfers to authorized order records. Preserve separate timestamps, source identifiers, and versioned logic so another analyst can reproduce the count and understand what it leaves out.
For analytics teams, blockchain data presents a familiar challenge in an unfamiliar format. Records may be accessible and structured, but business meaning still requires interpretation. A useful reporting system connects observable events to clearly defined metrics and preserves enough context for another analyst to reproduce the result.
- Define qualifying business events, exclusions, and rules for repeated observations before counting activity.
- Connect on-chain records with authorized off-chain context when a reliable reference exists.
- Keep event time, availability time, and ingestion time separate, alongside source identifiers and transformation details.
- Test classifications and reported totals against source records, even when the pipeline runs successfully.
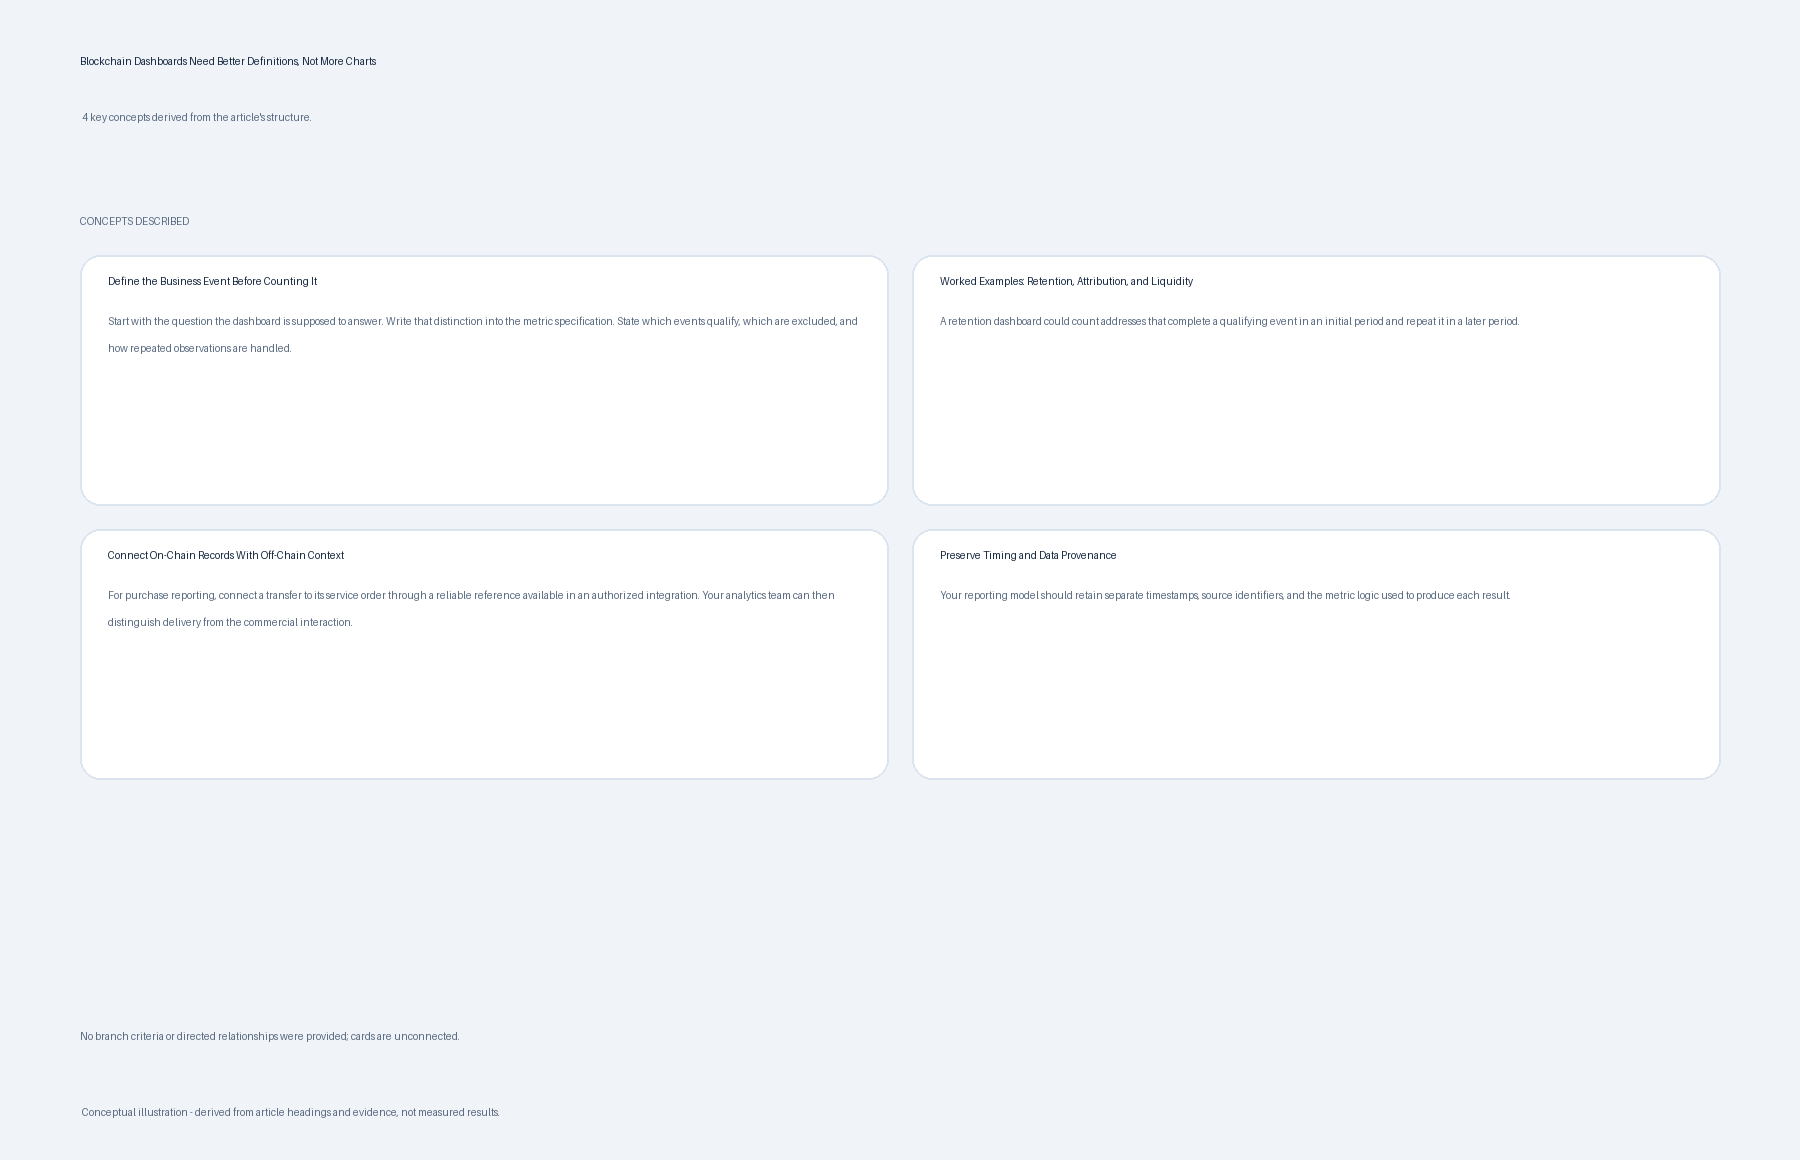
Define the Business Event Before Counting It
Start with the question the dashboard is supposed to answer. “How many transfers occurred?” differs from “How many customers completed a purchase?” The first concerns network activity; the second requires a definition of a customer and evidence of a completed commercial interaction.
Write that distinction into the metric specification. State which events qualify, which are excluded, and how repeated observations are handled. If the data supports only an address count, label it as an address count. A count of people requires separate evidence.
Internal activity also needs explicit treatment. Moving assets between wallets controlled by the same organization may be operationally necessary, but including those transfers in customer-volume reporting can produce a misleading picture.
A clear definition should survive a change in personnel. An analyst joining the team should be able to explain the metric without relying on undocumented assumptions from its original author.
Worked Examples: Retention, Attribution, and Liquidity
A retention dashboard could count addresses that complete a qualifying event in an initial period and repeat it in a later period. Your specification would name the event and both periods, then explain how repeated observations are handled. If the records identify addresses only, the label should say address retention. Calling the same count customer retention would require evidence connecting those addresses to customers.
For an attribution dashboard, consider a purchase metric that requires a completed service order linked to an on-chain delivery event. An unmatched transfer would remain unclassified under that definition. Your team would also state what evidence connects the order to its attributed source. The transfer alone cannot supply missing order terms or establish that connection.
More Read

Liquidity requires a different specification. Ment.tech lists liquidity and token flows among its dashboard subjects, but those labels still leave the counting rules open. In a hypothetical liquidity-activity report, you could count qualifying additions and withdrawals separately, with explicit treatment of internal movements. A count of those events would describe activity; it would not establish the balance available at a particular time.
Connect On-Chain Records With Off-Chain Context
For purchase reporting, connect a transfer to its service order through a reliable reference available in an authorized integration. Your analytics team can then distinguish delivery from the commercial interaction. Without that connection, the defensible metric remains observed movement, with the missing context left visible.
Those projects cover several practical analytics patterns: market monitoring, wallet activity, transaction inspection, and portfolio tracking. The combination is relevant for products that need multiple blockchain data sources presented through one consistent interface.
Khalil Ahmed in How to Build a Crypto Analytics Dashboard | Khalil AhmedA blockchain transfer records movement, but it does not necessarily explain the commercial arrangement behind it. Order details, customer permissions, quoted amounts, and service references may exist in separate systems.
Consider a customer who chooses to buy trx through an external service. A subsequent TRX transfer to their wallet does not, by itself, reveal the payment method, the original order terms, or every step involved in completing that purchase.
An analytics model should distinguish the service order from the on-chain delivery event. Where an authorized integration provides both records, connect them through a reliable reference. Where that connection is unavailable, preserve the uncertainty. The record does not support a purchase label.
Technical coverage matters too. TRON’s integration documentation distinguishes top-level transactions, contract events, and internal movements. Inspecting only one category can leave relevant activity outside the dataset.
The practical lesson is to document what the collection process can observe. A comprehensive-looking table is not evidence that every relevant event has been captured.
Preserve Timing and Data Provenance
Your reporting model should retain separate timestamps, source identifiers, and the metric logic used to produce each result. That lets analysts distinguish late arrivals and recovered records from changed classifications. The reporting period depends on the chosen timestamp, so event time and ingestion time cannot remain interchangeable.
A record can have several meaningful timestamps: when the underlying event occurred, when a provider made it available, and when the analytics pipeline ingested it. Combining these into a single field makes delays difficult to investigate.
Keep those concepts separate. A daily report based on ingestion time may place late-arriving activity in a different period from a report based on event time. Neither approach should be left implicit.
Preserve source identifiers and transformation details as well. When a reported figure changes, the team needs to determine whether the underlying activity changed, a missing interval was recovered, or classification logic was updated.
Retries require similar care. Reprocessing an interval should not inflate totals. Use identifiers appropriate to the record type, since a single transaction may contain multiple events that must remain distinguishable.
Versioning metric logic helps explain historical differences. Make revised definitions visible to dashboard users and document how they change the meaning of an established chart.
Test the Interpretation Alongside the Pipeline
Test whether each reported category matches its business definition by tracing sample records to their sources and comparing totals with an independently constructed sample. Your team should investigate missing fields, duplicates, and unclassified events. A successful pipeline run establishes execution, without establishing that its labels describe the underlying activity accurately.
A pipeline can run successfully while producing a poor business metric. Operational monitoring should therefore be paired with checks on classification and aggregation.
Review sample records from each category and trace them back to their source. Compare reported totals with an independently constructed sample. Investigate unexpected changes in missing fields, duplicate rates, and unclassified events.
Dashboard labels should reflect the limits of that work. “Observed transfers” communicates a narrower claim than “customer payments,” and that precision makes the report more useful.
What Each Reporting Component Establishes
| Component | What it establishes | Failure it helps expose |
|---|---|---|
| Business-event definition | Qualifying events, exclusions, and repeated-observation rules | Internal transfers counted as customer activity |
| Off-chain context | A reliable connection between an order and its delivery event | Transfers labeled as purchases without supporting records |
| Timing and provenance | Reporting timestamp, source identifiers, and transformation history | Late arrivals or revised logic mistaken for changed activity |
| Interpretation checks | Agreement between classifications, source samples, and reported totals | Successful processing that produces an unsupported business metric |
Blockchain analytics becomes credible through disciplined interpretation. Clear definitions, reliable links between records, and documented coverage give decision-makers a basis for understanding the numbers. Additional charts become valuable once the events beneath them have a meaning the team can defend.
FAQ
Tracing a record establishes what your data contains; defining a metric establishes what your team can claim from it. For blockchain reporting, that distinction depends on transaction coverage, links to off-chain records, and preserved provenance. The answers below separate observable activity from business interpretations that require additional evidence.
How to trace a blockchain transaction?
Use the source identifier to locate the underlying transaction record, then inspect the relevant event categories. For TRON, the article distinguishes top-level transactions, contract events, and internal movements. Preserve event-level identifiers where one transaction contains multiple events. Connecting that activity to a purchase also requires a reliable reference to the service order.
Why are blockchain dashboards misleading?
Rising counts may include internal transfers, automated activity, repeated observations, or changes in collection coverage. A transfer does not establish a customer purchase, and an address count does not establish a count of people. Labels become misleading when they imply business context the records cannot support.
How to define business events for blockchain data?
Specify the business question, qualifying events, exclusions, and treatment of repeated observations. State the evidence needed for labels such as customer or completed purchase. Document how internal wallet movements are handled, and use a narrower label when the dataset supports only observed transfers or addresses.
How to preserve data provenance in blockchain analytics?
For blockchain analytics, preserve data provenance by retaining source identifiers and transformation details alongside separate event, provider-availability, and ingestion timestamps. Use identifiers appropriate to each record type so retries do not inflate totals or collapse distinct events. Version the metric logic and make definition changes visible to dashboard users.
Check the Event Definition Before Adding Another Chart
A chart labeled customer payments needs records that support that interpretation. For your team, the release checkpoint is whether sampled entries meet the documented definition and trace to their sources. PowerMetrics makes the same distinction between dashboard numbers and metric definitions: definitions determine what those numbers mean.
A missing order reference leaves the purchase claim without support. Take a sampled entry from the proposed customer-payment metric and check its qualifying event, source identifier, and linked service order against the written specification. An unmatched transfer stays visible under the narrower label. Before accepting a revised total, check whether late arrivals, recovered intervals, or changed classification logic explain the difference. Reprocessing the same interval should not create additional counted events.