We use cookies, including third-party cookies from Google to serve personalized ads through AdSense, to operate this site and understand how it is used. By continuing to browse, you accept this use. See our Privacy Policy and Terms of Use for details, including how to opt out of personalized advertising.
Accept
SmartData CollectiveSmartData Collective
  • Analytics
    AnalyticsShow More
    chatgpt image jul 21, 2026, 04 34 30 pm
    4 Core Benefits of Predictive Maintenance after Vibration Analysis
    10 Min Read
    How Does Data Mining Boost Customer Satisfaction in Logistics? Harnessing Analytics for Results -- AI-generated illustration
    How Does Data Mining Boost Customer Satisfaction in Logistics? Harnessing Analytics for Results
    11 Min Read
    chatgpt image jul 13, 2026, 04 23 45 pm
    How Data Analytics Helps Companies Improve User Engagement
    19 Min Read
    chatgpt image jul 13, 2026, 03 59 46 pm
    How Data Analytics Improves Multi-Location Search Strategies
    10 Min Read
    cybersecurity efforts
    How Behavioral Analytics and AI Are Redefining Cybersecurity for Boca Raton Businesses
    14 Min Read
  • Big Data
  • BI
  • Exclusive
  • IT
  • Marketing
  • Software
Search
© 2008-25 SmartData Collective. All Rights Reserved.
Reading: Spectral Clustering Can Be A Game Changer—Here’s How
Share
Notification
Font ResizerAa
SmartData CollectiveSmartData Collective
Font ResizerAa
Search
  • About
  • Help
  • Privacy
Follow US
© 2008-23 SmartData Collective. All Rights Reserved.
SmartData Collective > Analytics > Modeling > Spectral Clustering Can Be A Game Changer—Here’s How
AnalyticsModeling

Spectral Clustering Can Be A Game Changer—Here’s How

Steve Jones
Steve Jones
5 Min Read
Spectral Clustering Can Be A Game Changer—Here's How
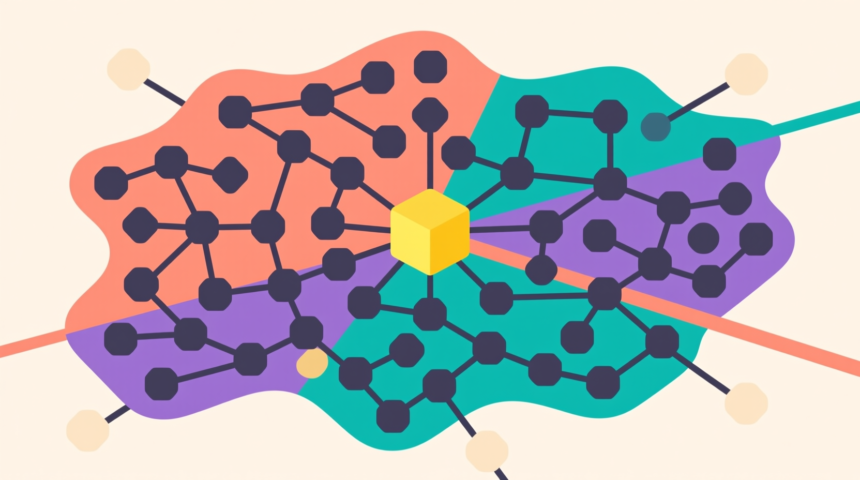
Illustration generated with Qwen Image.
SHARE

In many fields of exploratory data analysis, you will hear the term Spectral Clustering mentioned. Its widespread use comes from the ability it has to adapt to many different types of data, as well as finding ways to group data that may otherwise seem unrelated. Unlike other types of data processing, Spectral Clustering tends to look at the affinity of the data points – how connected they are to one another – rather than their actual location on a graph. This is where the power is in Spectral Clustering, and how we can use it in applications such as image processing and bioinformatics.

The Basic Steps

Spectral Clustering can be broken up into three smaller steps that create our clusters and then allow us to solve relations between related data points. Remember, Spectral Clustering only works if the data points within a certain set are closely related to each other, but are unrelated to other members outside of the chosen set. The steps we take in setting up for Spectral Clustering are:

  1. Generate a similarity graph between a number of objects. This is, in essence, our cluster. We can have as little as two clusters or dozens, depending on how disparate the data we’re looking at is. The similarity graph links these objects logically.
  2. Calculate the first set of eigenvectors up to a value of k for the Laplacian Matrix generated from our clusters. This allows us to define a feature vector for each individual cluster object.
  3. Run a k-means computation on those vectors in order to divide up those clusters into k classes.

Graph Methodology

When it comes to constructing the graphs, we have a pair of methods we can use. The first is the k-Nearest Neighbor (KNN) mapping which associates any particular point with its closest k-related neighbors, where k is an integer value that is related to local data relationships. The second method is called the ε-neighborhood graph which links relations based on the overlap of a ball with radius ε. The radius can be adjusted to fine-tune the relationship, as in the case of cloud storage applications. Generally, k-Nearest Neighbor gives a more connected view of the data than the ε-neighborhood graph. Due to how KNN is calculated, data that would be on different “scales” could theoretically be linked based on their characteristics. Ε-neighbor processing only gives an ear to the physical location of the points and while the radius can be adjusted, it’s unlikely that it would give as deep connectivity as KNN.

Calculating the Eigenvectors and K-Means Computation

Once the clusters are defined, we move on to creation of the Laplacian Matrix. Knowing the Weight Matrix (W) and the Diagonal (degree) matric (D) we can simply construct the Laplacian Matrix, L by the calculation D – W. Once we have L, we can move on to compute the eigenvectors of L. Finally, we apply the k-means algorithm to our clusters. What k-means seeks to accomplish is to separate the data we have into clusters with the nearest mean to the cluster we’re currently dealing with.

More Read

5 Powerful Ways Retailers Can Leverage Big Data and Hadoop
How Can Marketing Teams Leverage Data Analytics for Digital Asset Management
Can Big Data Help Bridge the Workplace Skills Gap?
Text Analytics: It’s Not Just for BIG Data
How Big Data and Analytics Are Changing Manufacturing for the Better

Choosing a Legitimate Value for k

If we take the points in our clusters and project them onto a non-linear embedding, then examine the eigenvalues relating to the Laplacian Matrices, we can make an inference as to what value of k we should be using for our processing.

Data Processing and Spectral Clustering

Scientific data can be better processed when it’s represented as clusters. This procedure allows a data set to be generalized using this procedure in order to prepare the data for more complex processing while at the same time offering unique insights into the data through the location and relation of the clusters formed.

TAGGED:data processinggraph methodologysmart data collectivespectral clustering
Share This Article
Facebook Pinterest LinkedIn
Share

Follow us on Facebook

Latest News

Analyst points at colorful circular data dashboard on screen - information technology business metrics
How Fragmented Workplace Tech Undermines Reliable Business Metrics and Reporting
Cloud Computing Exclusive Infographic IT
Using Multi-Source Data and Analytics to Detect Operational Drift Across Franchise Networks -- AI-generated illustration
Using Multi-Source Data and Analytics to Detect Operational Drift Across Franchise Networks
Exclusive Infographic
Beyond The First Impression: The Long-Lasting Impact Of Sensory Marketing -- AI-generated illustration
Beyond The First Impression: The Long-Lasting Impact Of Sensory Marketing
Infographic Marketing
The Infrastructure Gap Slowing Data Center Growth -- AI-generated illustration
The Infrastructure Gap Slowing Data Center Growth
Big Data Cloud Computing Exclusive Infographic IT

Stay Connected

1.2KFollowersLike
33.7KFollowersFollow
222FollowersPin

You Might also Like

Improving Data Processing with Spark 3.0 & Delta Lake
Data Lake

Improving Data Processing with Spark 3.0 & Delta Lake

12 Min Read
A Few Proven Suggestions for Handling Large Data Sets
Big Data

A Few Proven Suggestions for Handling Large Data Sets

8 Min Read
Python for Business: Optimize Pre-Processing Data for Decision-Making
Programming

Python for Business: Optimize Pre-Processing Data for Decision-Making

9 Min Read

SmartData Collective is one of the largest & trusted community covering technical content about Big Data, BI, Cloud, Analytics, Artificial Intelligence, IoT & more.

The Art of Conversation: Enhancing Chatbots with Advanced AI Prompts
Chatbots
From Bolts to Bots: How AI Is Fortifying the Automotive Industry
Artificial Intelligence

Quick Link

  • About
  • Contact
  • Privacy
Follow US
© 2008-26 SmartData Collective. All Rights Reserved.
Welcome Back!

Sign in to your account

Username or Email Address
Password

Lost your password?