Visual Complexity is a unified resource space for anyone interested in the visualization of complex networks.
The project’s main goal is to leverage a critical understanding of different visualization methods, across a series of disciplines, as diverse as Biology, Social Networks or the World Wide Web.
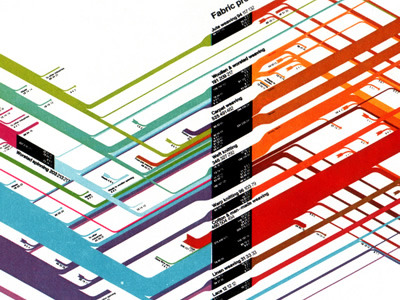
visualcomplexity.com | UK Textile Industry (1968-70)
This chart represents a flow of products through the UK textile industry from the intake of raw materials to the point at which products leave the textile and clothing industries.
Visual Complexity is a unified resource space for anyone interested in the visualization of complex networks.
The project’s main goal is to leverage a critical understanding of different visualization methods, across a series of disciplines, as diverse as Biology, Social Networks or the World Wide Web.
visualcomplexity.com | UK Textile Industry (1968-70)
This chart represents a flow of products through the UK textile industry from the intake of raw materials to the point at which products leave the textile and clothing industries.
The Smarter Planet tumblelog is an outgrowth of IBM’s strategic initiative to help a world of smart systems emerge.