Cookies help us display personalized product recommendations and ensure you have great shopping experience.

By using this site, you agree to the Privacy Policy and Terms of Use.
Accept
SmartData CollectiveSmartData Collective
  • Analytics
    AnalyticsShow More
    big data analytics in transporation
    Turning Data Into Decisions: How Analytics Improves Transportation Strategy
    3 Min Read
    sales and data analytics
    How Data Analytics Improves Lead Management and Sales Results
    9 Min Read
    data analytics and truck accident claims
    How Data Analytics Reduces Truck Accidents and Speeds Up Claims
    7 Min Read
    predictive analytics for interior designers
    Interior Designers Boost Profits with Predictive Analytics
    8 Min Read
    image fx (67)
    Improving LinkedIn Ad Strategies with Data Analytics
    9 Min Read
  • Big Data
  • BI
  • Exclusive
  • IT
  • Marketing
  • Software
Search
© 2008-25 SmartData Collective. All Rights Reserved.
Reading: A New Graphical Representation of the Periodic Table |…
Share
Notification
Font ResizerAa
SmartData CollectiveSmartData Collective
Font ResizerAa
Search
  • About
  • Help
  • Privacy
Follow US
© 2008-23 SmartData Collective. All Rights Reserved.
SmartData Collective > Big Data > Data Visualization > A New Graphical Representation of the Periodic Table |…
Data Visualization

A New Graphical Representation of the Periodic Table |…

JackMason
JackMason
2 Min Read
SHARE

A New Graphical Representation of the Periodic Table | VizWorld.com

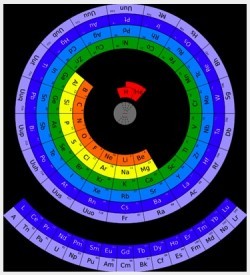
According to Mohd Abubakr from Microsoft Research in Hyderabad, the table can be improved by arranging it in circular form. He says this gives a sense of the relative size of atoms–the closer to the centre, the smaller they are–something that is missing from the current form of the table.

The Smarter Planet tumblelog is an outgrowth of IBM’s strategic initiative to help a world of smart systems emerge.

More Read

On Text Analytics vs Machine Translation
Geographic maps in R
Big Data: Are You Ready for Multimedia Information Systems?
Using R and Motion Charts to analyze financial data
Sneak Peak of Largest Ever MR Survey
Link to original post
To see just the posts related to the “new intelligence” — advanced business intelligence, predictive analytics, decision support and large scale data managment — try this link:
http://smarterplanet.tumblr.com/tagged/new_intelligence

 See this primer on Smarter Planet


A New Graphical Representation of the Periodic Table | VizWorld.com

According to Mohd Abubakr from Microsoft Research in Hyderabad, the table can be improved by arranging it in circular form. He says this gives a sense of the relative size of atoms–the closer to the centre, the smaller they are–something that is missing from the current form of the table.

The Smarter Planet tumblelog is an outgrowth of IBM’s strategic initiative to help a world of smart systems emerge.

Link to original post
To see just the posts related to the “new intelligence” — advanced business intelligence, predictive analytics, decision support and large scale data managment — try this link:
http://smarterplanet.tumblr.com/tagged/new_intelligence

 See this primer on Smarter Planet


Share This Article
Facebook Pinterest LinkedIn
Share

Follow us on Facebook

Latest News

AI role in medical industry
The Role Of AI In Transforming Medical Manufacturing
Artificial Intelligence Exclusive
b2b sales
Unseen Barriers: Identifying Bottlenecks In B2B Sales
Business Rules Exclusive Infographic
data intelligence in healthcare
How Data Is Powering Real-Time Intelligence in Health Systems
Big Data Exclusive
intersection of data
The Intersection of Data and Empathy in Modern Support Careers
Big Data Exclusive

Stay Connected

1.2kFollowersLike
33.7kFollowersFollow
222FollowersPin

You Might also Like

3-D Animation of the Changing Antarctic Ice Sheet

2 Min Read

The analyst function is dead

5 Min Read

Storytelling with Data to Rally Support for Your Position

4 Min Read
Singapore
Best PracticesBig DataCollaborative DataCommentaryData VisualizationLocationModelingPredictive AnalyticsSentiment AnalyticsSocial Data

Keeping Singapore Green with Data and Design

5 Min Read

SmartData Collective is one of the largest & trusted community covering technical content about Big Data, BI, Cloud, Analytics, Artificial Intelligence, IoT & more.

giveaway chatbots
How To Get An Award Winning Giveaway Bot
Big Data Chatbots Exclusive
ai in ecommerce
Artificial Intelligence for eCommerce: A Closer Look
Artificial Intelligence

Quick Link

  • About
  • Contact
  • Privacy
Follow US
© 2008-25 SmartData Collective. All Rights Reserved.
Go to mobile version
Welcome Back!

Sign in to your account

Username or Email Address
Password

Lost your password?