How Different Groups Spend Their Day – Interactive Graphic – NYTimes.com
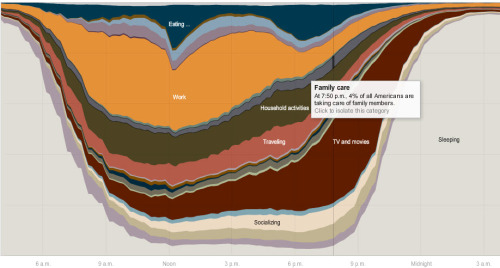
The American Time Use Survey asks thousands of American residents to recall every minute of a day. Here is how people over age 15 spent their time in 2008.
The Smarter Planet tumblelog is an outgrowth of IBM’s strategic initiative to help a world of smart systems emerge.
Link to original post
To see just the posts related to the “new intelligence” — advanced business intelligence, predictive analytics, decision support and large scale data managment — try this link:
How Different Groups Spend Their Day – Interactive Graphic – NYTimes.com
The American Time Use Survey asks thousands of American residents to recall every minute of a day. Here is how people over age 15 spent their time in 2008.
The Smarter Planet tumblelog is an outgrowth of IBM’s strategic initiative to help a world of smart systems emerge.
Link to original post
To see just the posts related to the “new intelligence” — advanced business intelligence, predictive analytics, decision support and large scale data managment — try this link: