We use cookies, including third-party cookies from Google to serve personalized ads through AdSense, to operate this site and understand how it is used. By continuing to browse, you accept this use. See our Privacy Policy and Terms of Use for details, including how to opt out of personalized advertising.
Accept
SmartData CollectiveSmartData Collective
  • Analytics
    AnalyticsShow More
    chatgpt image jul 21, 2026, 04 34 30 pm
    4 Core Benefits of Predictive Maintenance after Vibration Analysis
    10 Min Read
    How Does Data Mining Boost Customer Satisfaction in Logistics? Harnessing Analytics for Results -- AI-generated illustration
    How Does Data Mining Boost Customer Satisfaction in Logistics? Harnessing Analytics for Results
    11 Min Read
    chatgpt image jul 13, 2026, 04 23 45 pm
    How Data Analytics Helps Companies Improve User Engagement
    19 Min Read
    chatgpt image jul 13, 2026, 03 59 46 pm
    How Data Analytics Improves Multi-Location Search Strategies
    10 Min Read
    cybersecurity efforts
    How Behavioral Analytics and AI Are Redefining Cybersecurity for Boca Raton Businesses
    14 Min Read
  • Big Data
  • BI
  • Exclusive
  • IT
  • Marketing
  • Software
Search
© 2008-25 SmartData Collective. All Rights Reserved.
Reading: Anderson Analytics’ Seven Social Network Segments
Share
Notification
Font ResizerAa
SmartData CollectiveSmartData Collective
Font ResizerAa
Search
  • About
  • Help
  • Privacy
Follow US
© 2008-23 SmartData Collective. All Rights Reserved.
SmartData Collective > Uncategorized > Anderson Analytics’ Seven Social Network Segments
Uncategorized

Anderson Analytics’ Seven Social Network Segments

TomAnderson
TomAnderson
4 Min Read
Anderson Analytics’ Seven Social Network Segments
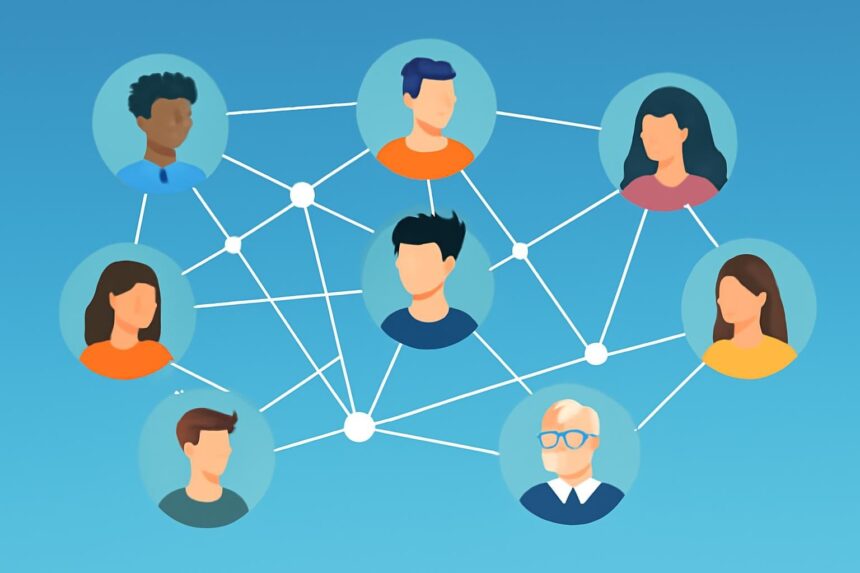
Illustrative image generated with OpenAI gpt-image-1.
SHARE

What Type of Social Network user are you? – A Social Network Usage Model

Segmenting the US population into various groups of social network Users and Non-Users can be challenging. Americans from all walks of life are now using social networks and are using them more so than email. Still others are skeptical and claim they will never try Facebook, MySpace, LinkedIn or Twitter.

In order to understand the current environment, specifically who is using social network services (SNS) now, and who is likely to be using them within the coming year, Anderson Analytics has created a multi-domain segmentation model. We looked at several variables from media usage to attitudes and behaviors in order to create seven groups of Online Americans. Four SNS User groups and three SNS Non User groups.

[We’ve distilled the more complex latent class segmentation model we created into something more manageable which only requires you to answer a few questions in four categories.]

More Read

Kosmix: I’m Impressed
The 3 Components of Digital Business Transformation
The Politics of Business Analytics
Chase Zander IT Director Forum – Report on Meeting 1 and Invitation to Meeting 2
Change Your Business One Metric At A Time

Feel free to try out the typing tool to find out which segment you are most likely to belong to: Social Network Typing Tool

We’d be curious to hear what you think? Let us know if you agree with your type?

I may post a bit more about each segment in the coming days.

@TomHCAnderson

PS. If you are on LinkedIn and would like to know what type of LinkedIn user you are try our LinkedIn typing tool from our LinkedIn study in 2008 HERE.

[Post to Twitter] Tweet This Post 

Link to original postTom H. C. Anderson – Anderson Analytics

TAGGED:analyticssocial mediasocial networks
Share This Article
Facebook Pinterest LinkedIn
Share

Follow us on Facebook

Latest News

Illustration of mobile analytics dashboards with ad performance charts connected to backend databases
11 Best Sisense Alternatives for Embedded Analytics
Business Intelligence Exclusive
Analyst points at colorful circular data dashboard on screen - information technology business metrics
How Fragmented Workplace Tech Undermines Reliable Business Metrics and Reporting
Cloud Computing Exclusive Infographic IT
Using Multi-Source Data and Analytics to Detect Operational Drift Across Franchise Networks -- AI-generated illustration
Using Multi-Source Data and Analytics to Detect Operational Drift Across Franchise Networks
Exclusive Infographic
Beyond The First Impression: The Long-Lasting Impact Of Sensory Marketing -- AI-generated illustration
Beyond The First Impression: The Long-Lasting Impact Of Sensory Marketing
Infographic Marketing

Stay Connected

1.2KFollowersLike
33.7KFollowersFollow
222FollowersPin

You Might also Like

Transparency and your online life
Uncategorized

Transparency and your online life

10 Min Read
The Business And Technological Benefits Of Data Lakes
Big DataData LakeExclusive

The Business And Technological Benefits Of Data Lakes

6 Min Read
Does the Future Lie with Embedded BI?
Uncategorized

Does the Future Lie with Embedded BI?

8 Min Read
8 data mining social networks with more than 2,000 members
Data Mining

8 data mining social networks with more than 2,000 members

3 Min Read

SmartData Collective is one of the largest & trusted community covering technical content about Big Data, BI, Cloud, Analytics, Artificial Intelligence, IoT & more.

The Art of Conversation: Enhancing Chatbots with Advanced AI Prompts
Chatbots
ai chatbot
How AI Website Chatbots Improve Customer Support and Lead Generation
Chatbots Exclusive

Quick Link

  • About
  • Contact
  • Privacy
Follow US
© 2008-26 SmartData Collective. All Rights Reserved.
Welcome Back!

Sign in to your account

Username or Email Address
Password

Lost your password?