A recent lunchtime conversation with a friend reminded me that data-mining/analytics/optimization opportunities are lurking everywhere.
It all started innocently enough. I miscalculated the tip at lunch and was about to leave a 10% tip (rather than the 20% that I was planning to) when my friend pointed out the error. He said that he had been sensitized to tip amounts by his college-age son who had done part-time/summer jobs as a restaurant waiter for several years. He went on to share fascinating examples of how his son made real-time decisions to maximize his tips.
I don’t know if waiters everywhere think this way, but my friend’s son (let’s call him Chuck) seems to have a great knack for “tiponomics”.
“These four old ladies walked in. They didn’t order any drinks. From past experience, I knew they wouldn’t be in a hurry to leave. They will occupy one of my four tables for several hours, have a small total check, and I will be lucky to get a 15% tip. I am not going to spend my time waiting on them hand and foot.”
“These two guys in suits walked in. They started off with some expensive drinks. It was clear that they were on an expense account. Also, I knew they would’t be sitting around for ever. If I really waited on them and responded quickly to every request, I knew I’d get a fat tip. So that’s where I will spend my time.”
Pretty savvy, eh?
More Read
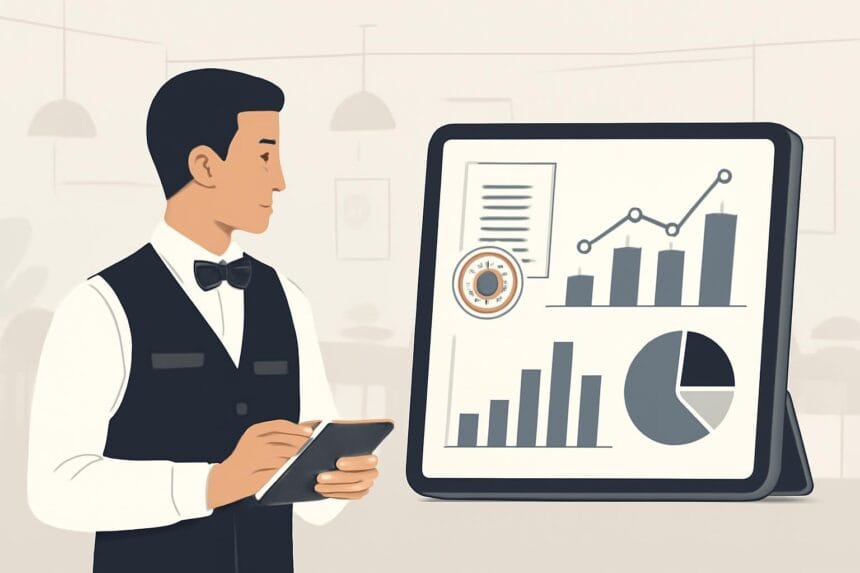
Let’s look at this through an analytics lens.
The key decision for Chuck to make is to decide how to allocate his time and attention across tables. The objective he is trying to maximize is the total tip amount over the duration of his shift. This is determined by the number of parties that come in to dine and the tip amount from each party. The latter, in turn, is the product of the check amount and the tip %.
The number of parties that come in to dine is obviously not in Chuck’s control. But if he can “turn over” his tables more, he can serve more guests and increase his tips per shift. It is not clear to me how he can increase his table turnover short of forcing guests to leave early (which, of course, will have dire consequences for Chuck sooner or later).
The check amount is driven by the number of people in that group, whether they order drinks or not, and what else they order. While the size of the group is clearly not in Chuck’s control, he can clearly affect the order by up-selling (e.g., the gratinati isn’t bad but I’d recommend the pasta stefano) and cross-selling (e.g., wine XYZ goes really well with this entree, a raita goes very well with this biriyani). In any event, since the up and cross-selling doesn’t add much time to taking the group’s order, there’s no time allocation decision to make – Chuck may as well do it.
The tip % is more interesting. Clearly, the more attentive and responsive Chuck is, the higher the tip %. But for the same dining experience, certain guest types may tend to tip more, others less. By data-mining historical data (“remembering past experience”), Chuck can take one look at the group and classify them as 10%/15%/25% tippers.
So can we put all this together (“Chuck’s Tips” ) to help a new waiter hit the ground running?
- When you take the guests’ orders, suggest up-sells and cross-sells. In the beginning, get ideas for what to suggest from more experienced waiters. As your “database” grows (see below), use your own experience to produce effective suggestions.
- Once the order is complete, estimate what the check amount will be.
- From what you have seen and heard so far, classify the guest group as 10%/15%/25% tippers. Again, in the beginning, get ideas for how to classify from more experienced waiters. As your “database” grows, use your own experience.
- Multiply (2) and (3) to come up with “an expected tip amount” from each group.
- Order all your current guest groups from high to low and focus your attention on the top few groups on the list.
- When a new group walks in, calculate their expected tip amount (as in 1-4), insert them into the sorted list and focus your attention accordingly.
IMPORTANT: After every session, add to your “database”
- which up-sell and cross-sell suggestions worked and which didn’t, in the context of the customer type
- the outcomes for each dining group (both the check amount and the tip %) as well as any interesting explanatory variables that may be linked to these outcomes (e.g., businessmen in suits, Indian-American vegetarian teetotaler family, five old ladies) so that your guesses become better with time.
Bon Appetit!