
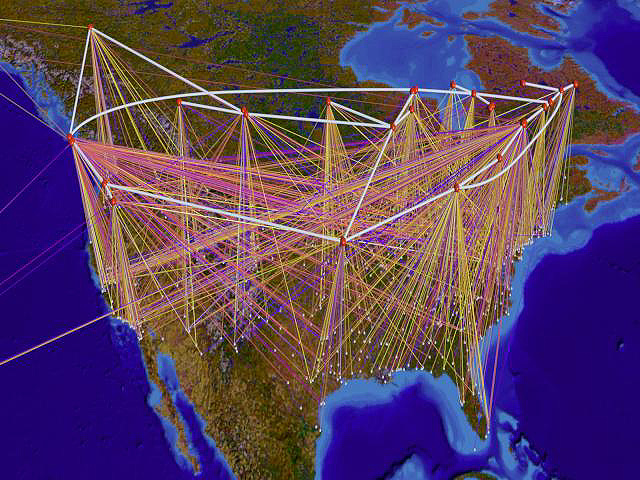
I selected a few from this Google search. Which one is best? Re-usable in other contexts? What about videos showing growth over time, or more sophisticated graphs where link thickness represents “Internet highway” bandwidth or speed.
I selected a few from this Google search. Which one is best? Re-usable in other contexts? What about videos showing growth over time, or more sophisticated graphs where link thickness represents “Internet highway” bandwidth or speed. And what about a video representing a simulated reflected DNS attack, rendering 10% of the Internet virtually dead, and showing how the attack spreads across the network?
.
Source: http://javiergs.com/?p=983 (a must read)


Source: http://bigpicture.typepad.com/writing/2006/11/what_does_the_i.html (600k links, 535k nodes)
Source: http://warcloud.net/whatis.html


