
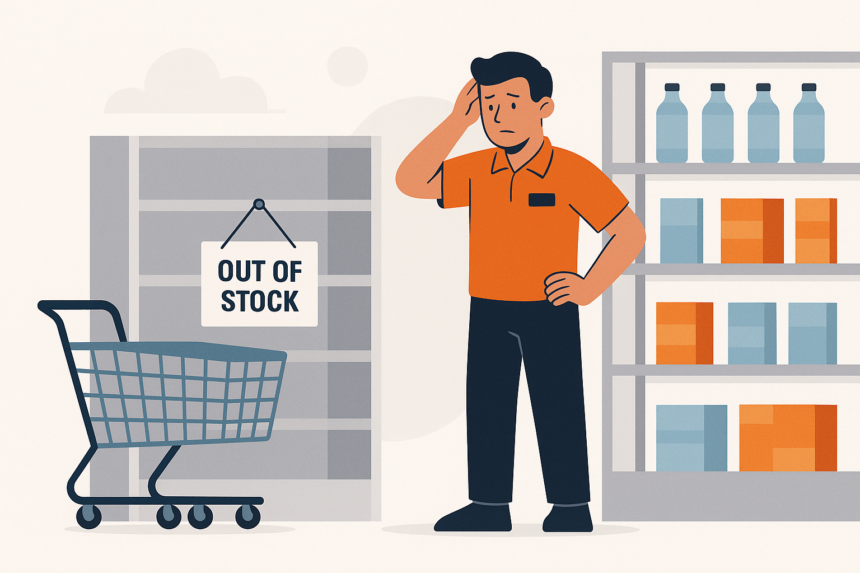
Retail management teams should rank stockouts by demand and margin at risk, rather than frequency alone. A clean stockout rate can hide the shortages that cost the most retail sales. Retailers love a clean stockout rate because it looks so decisive.
A stockout on a low-volume accessory at 10 a.m. on a Tuesday is not the same event as a stockout on a promoted bestseller on Saturday afternoon. Yet a basic stockout percentage can count them the same way. That is where a useful key performance indicator (KPI) starts turning into a misleading one. In retail analytics consulting services, this means linking stock availability to expected demand and margin before ranking stores or products.
Clearly, shoppers are concerned about product availability. SPAR Group’s 2025 shopper survey found that 74% of respondents said product availability was their top in-store priority and 73% identified out-of-stocks as a leading barrier to the in-store experience. Retailers already know stockouts matter. The question is whether the measurement tells you which stockouts are the most important.
A stockout count measures frequency, not damage
Most stockout metrics tell you how often an item was unavailable. They do not automatically tell you how much demand was sitting behind that unavailable item. The first problem is obvious once you look at the unit of measurement.

Beauty retailer KICKS traced 39% of lost sales during Christmas 2024 to one supplier, according to RELEX Solutions’ account of its work with KICKS. The account describes supplier-process changes and a 24-hour delivery completion requirement. A reported 34% reduction in lost-sales value linked to late deliveries followed. That is a usable diagnosis: a concentrated loss, a specific delivery problem and an operational response.
The difference gets even larger during promotions. A promoted item can have a short selling window and heavy demand concentration, making an empty shelf more costly. If the promotion is still running while the shelf is empty, the retailer is paying to create demand it cannot fulfill.
This is why I would never use stockout rate by itself as a store ranking. It is a useful operating measure, but it is not a severity score.
Weight the problem by demand, margin and customer behavior
A more useful view asks how much demand was expected during each stockout and how much economic value was attached to that demand. Then consider whether the shopper is likely to substitute rather than leave. Those questions give your team a basis for setting priorities.
The simplest improvement is demand weighting. Estimate expected sales during the actual out-of-stock hours, rather than treating every unavailable product-hour as equal. The same applies to margin. A lost sale of a high-margin product may warrant more attention than a lost sale of a low-margin product.
Customer behavior makes the problem less neat but more real. According to Salsify’s Q4 2025 Ecommerce Pulse Report, 58% of shoppers bought a different product from another brand when their usual brand was unavailable, and 33% purchased the product from another domestic retailer. A stockout can therefore leak value through the missing item or the rest of the basket. Future loyalty may be at risk too.
A retail dashboard should distinguish stockout occurrence from stockout exposure. Occurrence answers, “How many times were we not available?” For exposure, the question is how much commercial risk sat behind those events.
Promotions and omnichannel make the average even less useful
Omnichannel retail, where stores and online channels share inventory, makes stock availability harder to interpret because the same inventory can serve several customer journeys. A unit may be recorded as on hand but reserved for pickup or still being processed in receiving. Stock misplaced on the sales floor may also be unavailable for online fulfillment. Stale inventory records can add to the discrepancy.
The same stock-keeping unit (SKU), the identifier for a distinct product, can look available in one view and unavailable when the customer needs it. Your retail tech must distinguish recorded inventory from inventory that can actually fulfill the order.
Research published in the Journal of Retailing in 2025 adds another reason not to treat fulfillment failures as a one-off event: in the omnichannel grocery operation studied, an order that was not fulfilled as expected delayed the customer’s next order by 7.22% on average. Spending also fell. Those reductions were especially visible when promoted items failed to ship.
That is a very different business problem from simply saying, “The item was out of stock.” The event can affect the current order, the substitution decision and the timing of the next purchase.
Use three layers: occurrence, exposure and action
A useful retail dashboard separates stockout frequency from commercial exposure. Then it identifies the action needed. The fix does not require a giant inventory model. It requires a better separation of questions.
The first layer is occurrence. Keep familiar supply chain performance measures such as stockout rate and availability rate. Record how many SKUs were affected and how long each event lasted. These measures tell operations how often the problem is happening.
The second layer is exposure. Start with projected demand for the out-of-stock period and estimated lost sales, then consider product margin. Flag promotions separately and explain why the SKU or category matters. Lost-sales exposure is an estimate for decision-making, not a booked accounting loss, so the assumptions need to be clear.
Action is the third layer. Identify the store and SKU before deciding which vendor or replenishment process needs attention. Are fast sellers driving the problem? Did the stockout start after a promotion?
Is the same store repeatedly running out of the same products? Is there inventory elsewhere in the network while demand remains unmet? Those are practical questions for real-time supply chain analytics to help answer.
A useful retail dashboard combines store-level stockout rates with estimated lost-sales exposure and at-risk inventory. One KPI tells you how often stockouts occur. The surrounding measures help determine what to do about them.
Stop rewarding a good average
A short list of exceptions is better than yet another league table for a weekly retail review. Retail dashboards are full of averages that look good until someone asks where the damage is concentrated. One is the stockout rate.
A few high-value stores, products or trading periods can take most of the commercial pain, leaving a portfolio to sit comfortably within an availability target. The average is not incorrect. It’s just too polite.
Which high-demand SKUs were out of stock? Which stockouts happened to coincide with promotions? Where are estimated lost sales increasing? Which stores are still missing the same products?
What problems can be solved by replenishment or transfer? Where does the team need supplier action or improved inventory accuracy? Those questions make availability an operational decision, not a reporting metric.
At your next store-management review, assign an owner and a deadline to the highest-exposure stockout. Keep the exception open until the team checks whether the fix restored availability during the selling window that mattered. Frequency matters, but severity should determine where the team acts first.