We use cookies, including third-party cookies from Google to serve personalized ads through AdSense, to operate this site and understand how it is used. By continuing to browse, you accept this use. See our Privacy Policy and Terms of Use for details, including how to opt out of personalized advertising.
Accept
SmartData CollectiveSmartData Collective
  • Analytics
    AnalyticsShow More
    chatgpt image jul 21, 2026, 04 34 30 pm
    4 Core Benefits of Predictive Maintenance after Vibration Analysis
    10 Min Read
    How Does Data Mining Boost Customer Satisfaction in Logistics? Harnessing Analytics for Results -- AI-generated illustration
    How Does Data Mining Boost Customer Satisfaction in Logistics? Harnessing Analytics for Results
    11 Min Read
    chatgpt image jul 13, 2026, 04 23 45 pm
    How Data Analytics Helps Companies Improve User Engagement
    19 Min Read
    chatgpt image jul 13, 2026, 03 59 46 pm
    How Data Analytics Improves Multi-Location Search Strategies
    10 Min Read
    cybersecurity efforts
    How Behavioral Analytics and AI Are Redefining Cybersecurity for Boca Raton Businesses
    14 Min Read
  • Big Data
  • BI
  • Exclusive
  • IT
  • Marketing
  • Software
Search
© 2008-25 SmartData Collective. All Rights Reserved.
Reading: Driving Data: A Slippery Ethical Slope?
Share
Notification
Font ResizerAa
SmartData CollectiveSmartData Collective
Font ResizerAa
Search
  • About
  • Help
  • Privacy
Follow US
© 2008-23 SmartData Collective. All Rights Reserved.
SmartData Collective > IT > Mobility > Driving Data: A Slippery Ethical Slope?
AnalyticsData ManagementITMobilityPrivacySecurity

Driving Data: A Slippery Ethical Slope?

paulbarsch
paulbarsch
5 Min Read
Driving Data: A Slippery Ethical Slope?
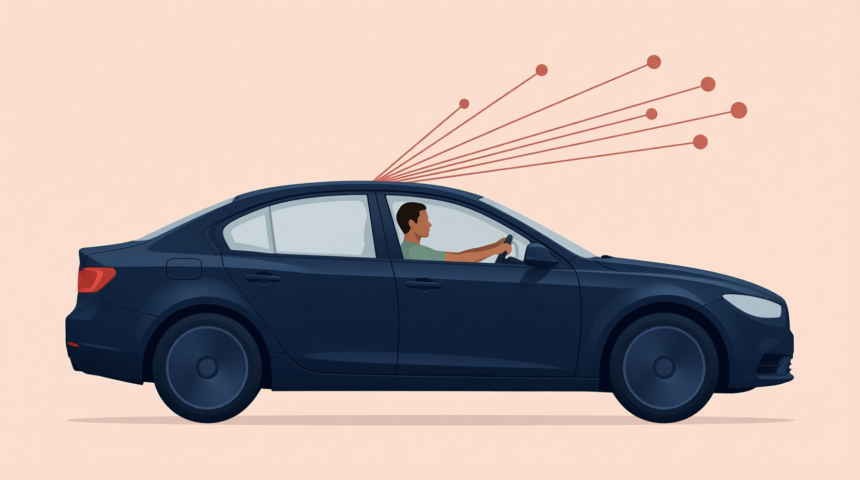
Illustration generated with Qwen Image.
SHARE

When thinking about telematics, it’s easy to conjure up images of fleet tracking via GPS, satellite navigation systems for driving directions, or even the ubiquitous onboard security and diagnostic systems. However, what’s less understood is that data on your driving habits, locations and more are being collected, sometimes without your explicit knowledge.

Most people don’t realize that driving data are being collected in 80% of the cars sold in the United States.  According to an Economist article, event data recorders (EDRs) are installed in most cars to analyze how airbags are deployed.  Some EDRs can also record events such as “forward and sideway acceleration and deceleration, vehicle speed, engine speed and steering inputs.”  

The Economist article also says EDR data can show if a driver stepped on the gas just before an accident, or how quickly brakes were applied. And EDRs can also record whether seat belts were locked. These data can be used to augment a police crash report, corroborate accident events as remembered by a driver, or even be used against a driver when negligence is suspected.

This brings to mind a key question – who owns this data? The Economist article says that if you are the car owner, it’s probably you. However, if your car is totaled from a crash, and you sell it to the insurance company as part of a claim resolution process, then it’s likely your insurance company now owns the data.

More Read

Using Data for K-12 Education
The Internet of Things and Applied Digital Strategy
Behind AmazonSupply, a Nuts-and-Bolts Service Oriented Architecture
Digital Transformation Has Spurred an Unexpected Renaissance in the Age of Big Data
Living in the Cloud

Data can be used for purposes advantageous and disadvantageous to a driver.

An MIT Technology Review article cites how a new $70 device is now available to hook into your car’s EDR. This device wirelessly transmits data via Bluetooth to your mobile phone on your driving efficiency, cost of your daily commute, and information on possible engine issues.  And the company providing the device can deliver a “score” for your driving habits, gas savings and safety in relation to other drivers.

Driving data can also be collected for things you did not intend. For example, a team of scientists used mobile phone location data gleaned from wireless networks to detect commute patterns from more than 1 million users over three weeks in the San Francisco Bay Area. 

These scientists discovered “cancelling some car trips from strategically located neighborhoods could drastically reduce gridlock and traffic jams.”  In other words, some neighborhoods are responsible for a fair portion of Bay Area freeway congestion.  The scientists claimed by cancelling just 1% of trips from these neighborhoods, congestion for everyone else could be reduced by 14%.

Of course, drivers in urban areas could be incentivized to use public transportation, carpool or telecommute, but it’s also possible that a more heavy-handed government approach could restrict commutes from these neighborhoods—on certain days—“for the good of all.”

Data are of course, benign. However, driving data from GPS and other devices are collected daily—and sometimes without your consent.

Altruistically, these data may ultimately be used to design better cars, better freeways and improve the overall quality of life for everyone concerned. Yet, it’s also important to realize that mobile data from daily road travels can also be utilized for tracking purposes, to pin down exactly where you are located at any given moment in time, and how you arrived. And that thought should give everyone pause.

TAGGED:driving dataEDRgpsmobile analyticstelematics
Share This Article
Facebook Pinterest LinkedIn
Share

Follow us on Facebook

Latest News

Illustration of mobile analytics dashboards with ad performance charts connected to backend databases
11 Best Sisense Alternatives for Embedded Analytics
Business Intelligence Exclusive
Analyst points at colorful circular data dashboard on screen - information technology business metrics
How Fragmented Workplace Tech Undermines Reliable Business Metrics and Reporting
Cloud Computing Exclusive Infographic IT
Using Multi-Source Data and Analytics to Detect Operational Drift Across Franchise Networks -- AI-generated illustration
Using Multi-Source Data and Analytics to Detect Operational Drift Across Franchise Networks
Exclusive Infographic
Beyond The First Impression: The Long-Lasting Impact Of Sensory Marketing -- AI-generated illustration
Beyond The First Impression: The Long-Lasting Impact Of Sensory Marketing
Infographic Marketing

Stay Connected

1.2KFollowersLike
33.7KFollowersFollow
222FollowersPin

You Might also Like

Here's How Big Data Is Revolutionizing GPS Technology
Big DataExclusive

Here’s How Big Data Is Revolutionizing GPS Technology

6 Min Read
GPS location data
Big DataExclusive

New Report Shows Big Data Plays Key Role In Improving Driver Safety

5 Min Read
10 Don’ts for Delivering Mobile Business Intelligence
AnalyticsBusiness IntelligenceCollaborative DataData VisualizationDecision ManagementKnowledge Management

10 Don’ts for Delivering Mobile Business Intelligence

14 Min Read
Location Intelligence and Mobile BI: Advancing the ‘where’ in mining and exploration
AnalyticsBusiness IntelligenceData VisualizationExclusiveLocation

Location Intelligence and Mobile BI: Advancing the ‘where’ in mining and exploration

7 Min Read

SmartData Collective is one of the largest & trusted community covering technical content about Big Data, BI, Cloud, Analytics, Artificial Intelligence, IoT & more.

The Art of Conversation: Enhancing Chatbots with Advanced AI Prompts
Chatbots
5 Great Tips for Using Data Analytics for Website UX
Big Data

Quick Link

  • About
  • Contact
  • Privacy
Follow US
© 2008-26 SmartData Collective. All Rights Reserved.
Welcome Back!

Sign in to your account

Username or Email Address
Password

Lost your password?