

Technology is quickly becoming a critical component of our existence. Today, technology powers every important aspect of our life, from business to education to medicine. It has greatly aided in the automation of formerly manual activities, making everything more smooth and efficient.
However, computerization in the digital age creates massive volumes of data, which has resulted in the formation of several industries, all of which rely on data and its ever-increasing relevance. Data analytics and visualization help with many such use cases.
It is the time of big data. Everything is driven by data in business. Here is where data analytics and visualization come into play. While most people are unfamiliar with these terms, investing in data analytics and visualization can mean the difference between success and failure.
What Is Data Analytics?
As previously said, the rise of technology is a crucial driving factor in every aspect of today’s world, which has resulted in huge data generation. Organizations cannot understand this huge amount of data without the help of the data analytics process.
More Read

Analytics is a wide phrase that includes several subfields. It encompasses all the data products, tools, and actions required in data processing to provide significant insights and interpretations. It is important to note that data analytics relies on computer tools and software to collect and analyze data so that business choices may be made properly.
Data analytics is widely used in business since it allows organizations to better understand their consumers and improve their advertising strategies. Because of the various advances, this is a highly dynamic sector.
Five Best Practices for Data Analytics
1. Select a Storage Platform
Extracted data must be saved someplace. There are several choices to consider, each with its own set of advantages and disadvantages:
Data warehouses are used to store data that has been processed for a specific function from one or more sources. Data lakes hold raw data that has not yet been altered to meet a specific purpose. Data marts are smaller versions of warehouses that are frequently devoted to a particular team or department. To support a data-intensive system, databases are frequently used to store data from a single source.
2. Prioritize
More data is available to your brand than it knows how to handle. Rather than attempting to include everything in your data analysis process, eliminate what is unnecessary. Determine which data inputs are most valuable to your brand, in other words.
Key performance indicators (KPIs) help with that. So, how KPIs assist in determining what is essential for your organization will shape much of your company’s future decision-making.
Remember that what is important to the marketing team may not be important to the sales team, which may not be important to the customer service department, and so forth. You must ensure that every department is on board because different teams will give different KPIs varying amounts of weight.
Make better business decisions using the insights given by the data you’ve acquired and evaluated. These judgments should not feel like guesses but rather cold, calculating movements based on data.
This is all about customer data management, which we’ll go into in depth later. For the time being, all you need to know is that data segregated in separate systems and platforms is data squandered. Mining various data sources for useful insights is both challenging and inefficient. What you need for your brand is a truly unified data management platform that allows you to understand customers on an individual level and take smart, decisive action.
3. Real-time AI Revision and Optimization
You may alter and improve your brand’s interaction with specific customers in real time by implementing artificial intelligence and machine learning into your procedures for managing and analyzing customer data.
A self-correcting user experience powered by AI and machine learning data analysis has tremendous advantages. Personalized, pertinent interactions will make it possible to boost short- and long-term sales volume, per-sale value, customer pleasure, customer retention, and many other factors.
4. Understand Your Audience
It is critical to keep your audience in mind while developing visualizations. Please answer the following questions: Who will be reviewing the data? What difficulties does the audience face? How can dashboards help them overcome obstacles? Resist the urge to create generic dashboards and instead make sure they meet the needs of decision-makers.
5. Key Areas
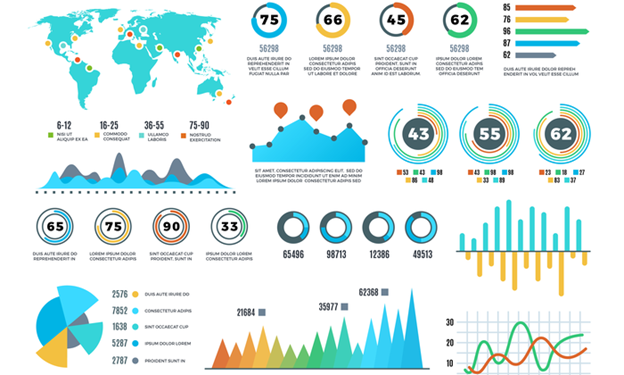
To capture attention, make sure that vital sections are emphasized. You have the option of placing crucial data points in popular regions.
Increase dwell time and facilitate better data understanding by directing attention with conditional formatting, reference lines, trends, or forecasts.
Summary
Following the best practices for customer data analysis and the recommended strategy for selecting a customer data management solution will revolutionize your organization. However, it will not revolutionize your company overnight. It takes time and work to achieve your large-scale customer-centric goals and ongoing effort to gain a deeper understanding of each client.
But if you’re ready to follow the best practices outlined in this article, this transition will occur, and your consumers will thank you later.