A New Graphical Representation of the Periodic Table | VizWorld.com
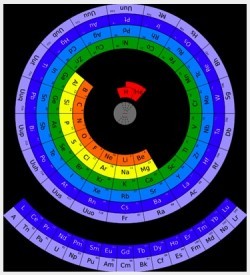
According to Mohd Abubakr from Microsoft Research in Hyderabad, the table can be improved by arranging it in circular form. He says this gives a sense of the relative size of atoms–the closer to the centre, the smaller they are–something that is missing from the current form of the table.
The Smarter Planet tumblelog is an outgrowth of IBM’s strategic initiative to help a world of smart systems emerge.
A New Graphical Representation of the Periodic Table | VizWorld.com
According to Mohd Abubakr from Microsoft Research in Hyderabad, the table can be improved by arranging it in circular form. He says this gives a sense of the relative size of atoms–the closer to the centre, the smaller they are–something that is missing from the current form of the table.
The Smarter Planet tumblelog is an outgrowth of IBM’s strategic initiative to help a world of smart systems emerge.