


We use cookies, including third-party cookies from Google to serve personalized ads through AdSense, to operate this site and understand how it is used. By continuing to browse, you accept this use. See our Privacy Policy and Terms of Use for details, including how to opt out of personalized advertising.
Accept
SmartData CollectiveSmartData Collective
  • Analytics
    AnalyticsShow More
    What Kind of Problem-Solving Distinguishes Data Analysts From Software Engineers -- AI-generated illustration
    What Kind of Problem-Solving Distinguishes Data Analysts From Software Engineers
    7 Min Read
    chatgpt image jul 21, 2026, 04 34 30 pm
    4 Core Benefits of Predictive Maintenance after Vibration Analysis
    10 Min Read
    How Does Data Mining Boost Customer Satisfaction in Logistics? Harnessing Analytics for Results -- AI-generated illustration
    How Does Data Mining Boost Customer Satisfaction in Logistics? Harnessing Analytics for Results
    11 Min Read
    chatgpt image jul 13, 2026, 04 23 45 pm
    How Data Analytics Helps Companies Improve User Engagement
    19 Min Read
    chatgpt image jul 13, 2026, 03 59 46 pm
    How Data Analytics Improves Multi-Location Search Strategies
    10 Min Read
  • Big Data
  • BI
  • Exclusive
  • IT
  • Marketing
  • Software
Search
© 2008-25 SmartData Collective. All Rights Reserved.
Reading: Twitter Words Association Analysis
Share
Notification
Font ResizerAa
SmartData CollectiveSmartData Collective
Font ResizerAa
Search
  • About
  • Help
  • Privacy
Follow US
© 2008-23 SmartData Collective. All Rights Reserved.
SmartData Collective > Business Intelligence > Market Research > Twitter Words Association Analysis
AnalyticsMarket ResearchSocial Data

Twitter Words Association Analysis

gunjan
gunjan
1 Min Read
Twitter Words Association Analysis
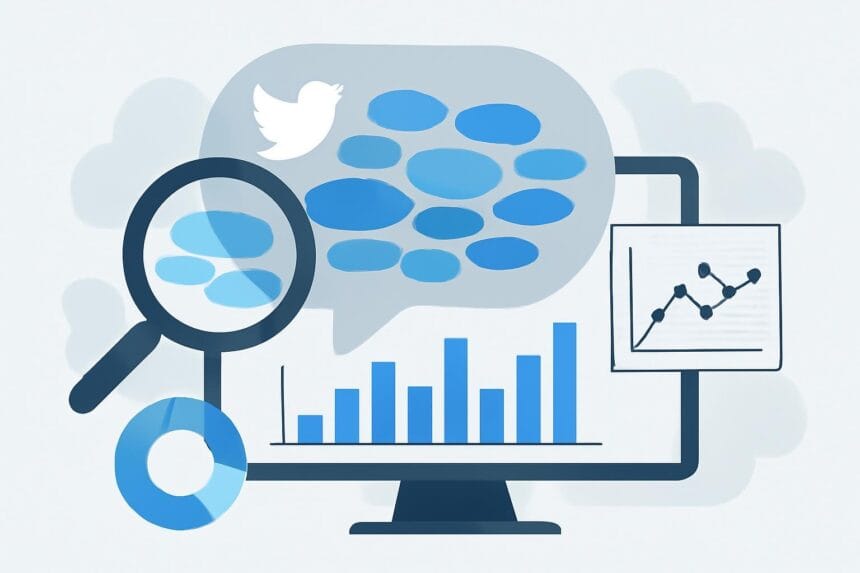
Illustrative image generated with OpenAI gpt-image-1.
SHARE

Recently I came across Twitter Spectrum tool from Jeff Clerk. This tool is modified version of News Spectrum tool.

Here you can enter two topics and then analyse the associated words based on twitter data. Blue and Red color represents the associated words of those two topics whereas Purple represents the common words.

You can click on any word to see the related tweets. The visualization is really awesome and you can easily analyze the data.

For example, I have taken “icici” and “hdfc” as two topics. Below is the twitter spectrum based on these two topics:
If you analyze the associated words, you will find that “Security”, “Insurance” words are associated more with ICICI bank whereas “digital”is associated with HDFC bank.
 
But words like “online banking”, “mobile banking” are still missing. This type of visualization will help the brand to plan their startegy of type of tweets to be posted on twitter.


Tool URL : http://www.neoformix.com/Projects/TwitterSpectrum/TwitterSpectrum.html

Do you have any other similar tool to share? Please tell us about your tool via comments.
Share This Article
Facebook Pinterest LinkedIn
Share

Follow us on Facebook

Latest News

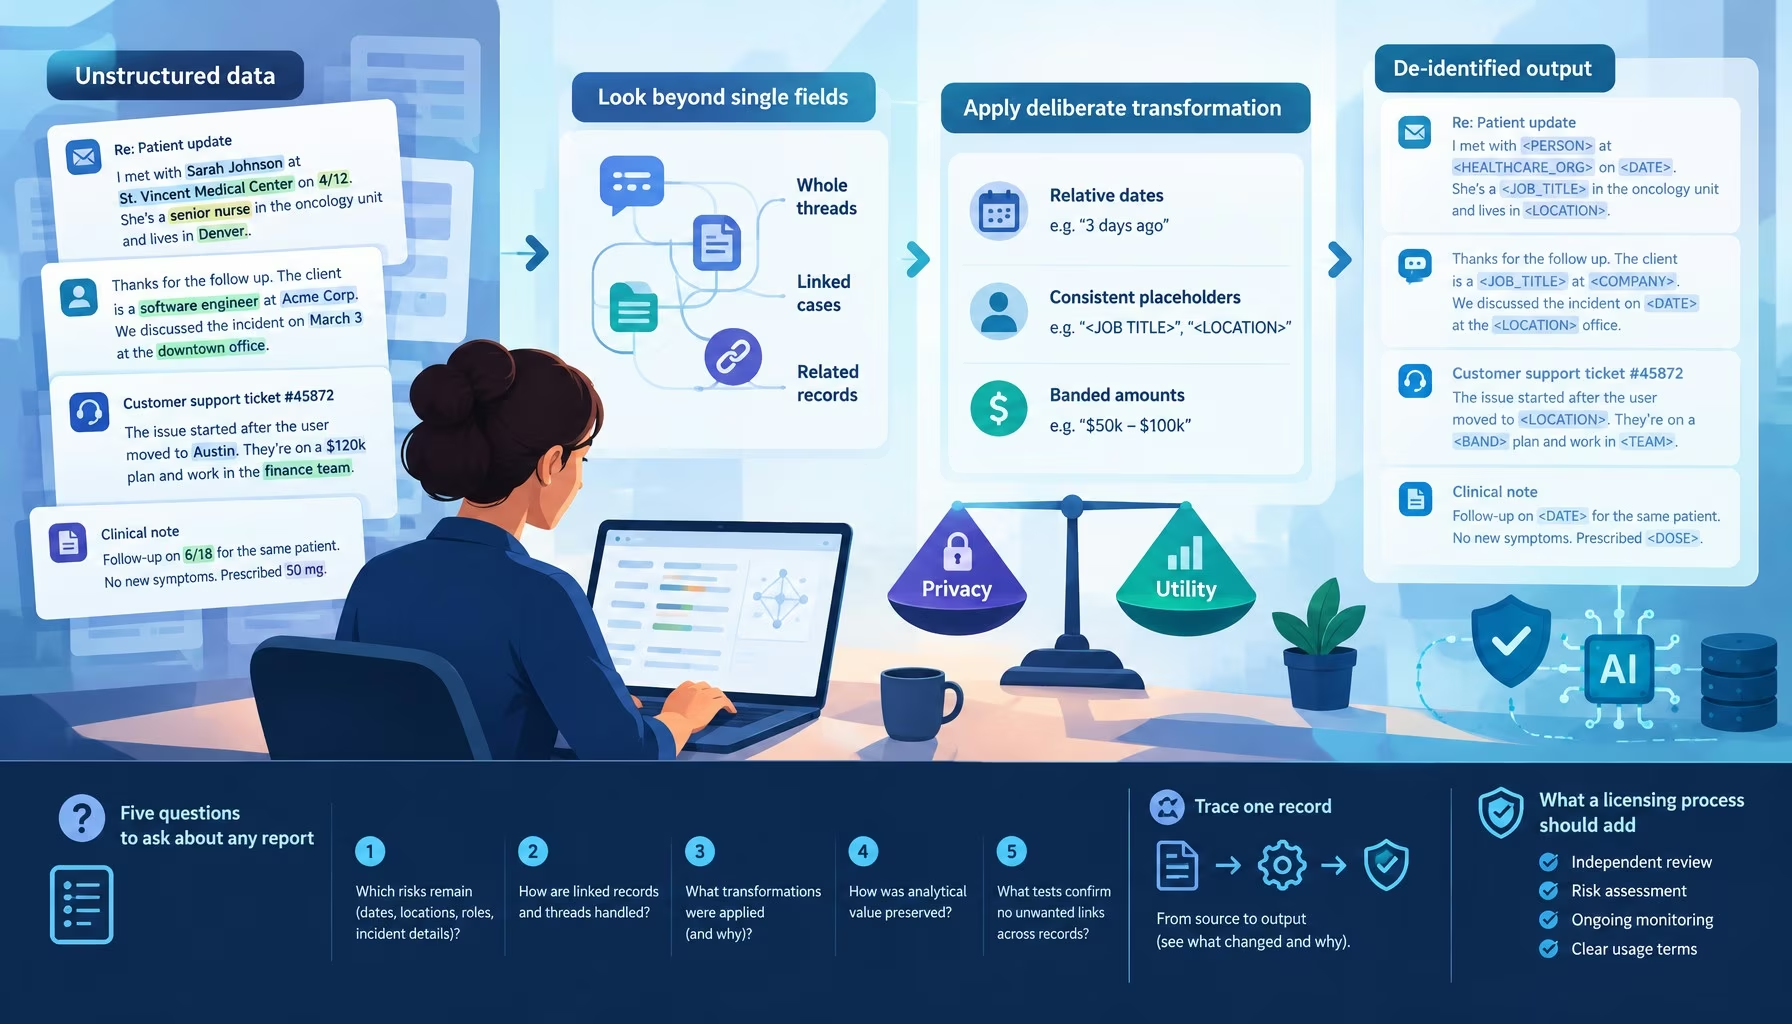
Flat editorial illustration: A tech-editorial depiction of contextual re-identification risk in linked unstructured support recor
Stripping the Names Isn’t Enough: De-Identifying Unstructured Data
Exclusive Unstructured Data
Flat editorial illustration: The article connects practical management of local data, memory and software environments with direc
How Data Professionals Optimize Devices for AI and ML Projects
Artificial Intelligence Data Science Exclusive Machine Learning
Flat editorial illustration: The article connects verified lease abstraction at signing to accurate property charges and faster m
AI Lease Abstraction and Month-End Close Speed-Up Checklist
Artificial Intelligence Exclusive
Flat editorial illustration: The article explains that file-system choice determines whether Windows, macOS, and Linux can read o
Understanding File System Compatibility Across Windows, macOS, and Linux
Cloud Computing Exclusive

Stay Connected

1.2KFollowersLike
33.7KFollowersFollow
222FollowersPin

You Might also Like

6 Innovative Dashboards
AnalyticsBusiness IntelligenceData VisualizationMarketingModeling

6 Innovative Dashboards

3 Min Read
How Data Analytics Improves Customer Journeys Behind the Scenes
Big Data

How Data Analytics Improves Customer Journeys Behind the Scenes

6 Min Read
Worst Practices While Deploying a Predictive Model
Predictive Analytics

Worst Practices While Deploying a Predictive Model

10 Min Read
Moneyball & the Analytics of a Red Sox Playoff Panic
AnalyticsStatistics

Moneyball & the Analytics of a Red Sox Playoff Panic

6 Min Read

SmartData Collective is one of the largest & trusted community covering technical content about Big Data, BI, Cloud, Analytics, Artificial Intelligence, IoT & more.

5 Great Tips for Using Data Analytics for Website UX
Big Data
From Bolts to Bots: How AI Is Fortifying the Automotive Industry
Artificial Intelligence

Quick Link

  • About
  • Contact
  • Privacy
Follow US
© 2008-26 SmartData Collective. All Rights Reserved.
Welcome Back!

Sign in to your account

Username or Email Address
Password

Lost your password?