
We use cookies, including third-party cookies from Google to serve personalized ads through AdSense, to operate this site and understand how it is used. By continuing to browse, you accept this use. See our Privacy Policy and Terms of Use for details, including how to opt out of personalized advertising.
Accept
SmartData CollectiveSmartData Collective
  • Analytics
    AnalyticsShow More
    What Kind of Problem-Solving Distinguishes Data Analysts From Software Engineers -- AI-generated illustration
    What Kind of Problem-Solving Distinguishes Data Analysts From Software Engineers
    7 Min Read
    chatgpt image jul 21, 2026, 04 34 30 pm
    4 Core Benefits of Predictive Maintenance after Vibration Analysis
    10 Min Read
    How Does Data Mining Boost Customer Satisfaction in Logistics? Harnessing Analytics for Results -- AI-generated illustration
    How Does Data Mining Boost Customer Satisfaction in Logistics? Harnessing Analytics for Results
    11 Min Read
    chatgpt image jul 13, 2026, 04 23 45 pm
    How Data Analytics Helps Companies Improve User Engagement
    19 Min Read
    chatgpt image jul 13, 2026, 03 59 46 pm
    How Data Analytics Improves Multi-Location Search Strategies
    10 Min Read
  • Big Data
  • BI
  • Exclusive
  • IT
  • Marketing
  • Software
Search
© 2008-25 SmartData Collective. All Rights Reserved.
Reading: Packages for By-Group Processing in R
Share
Notification
Font ResizerAa
SmartData CollectiveSmartData Collective
Font ResizerAa
Search
  • About
  • Help
  • Privacy
Follow US
© 2008-23 SmartData Collective. All Rights Reserved.
SmartData Collective > Big Data > Data Mining > Packages for By-Group Processing in R
Business IntelligenceData MiningR Programming Language

Packages for By-Group Processing in R

DavidMSmith
DavidMSmith
2 Min Read
Packages for By-Group Processing in R
Photo by ClickerHappy on Pixabay (https://pixabay.com/photos/mill-workshop-milling-industry-2881180/)
SHARE

Analyst and BI expert Steve Miller takes a look at the facilities in R for doing “by-group” processing of data. The task consisted of:

… read several text files, merge the results, reshape the intermediate data, calculate some new variables, take care of missing values, attend to meta data, execute a few predictive models and graph the results.

Then repeat the models and graphs for groups or sub-populations marked by distinct values of one or more dimension variables of interest.

The latter step is commonly referred to as “by-group processing.” SAS programmers will recognize by group processing with syntax that invokes a procedure on a sorted data set that looks something like:

proc reg data = dblahblah; by vblahblah;

Check out Steve’s post for how he addressed this in R using the high-performance data.table package by Matthew Dowle (and as Steve suggests, a good place to get started is the example vignettes). 

I’d also add a recommendation for the plyr package which also offers tools to split up data sets by various criteria, and then do by-processing. Here, the plyr: divide and conquer guide is a good place to start. As an added bonus, you can also divide and conquer the computations by exploiting multiple nodes in parallel by engaging a parallel backend for the foreach function. (Note for Windows users: the doSMP backend from Revolution R is also available now on R-Forge and will be on CRAN soon, too.)

Information Management: By-Group Processing, the R data.table and the Power of Open Source

More Read

Putting Historic Business Data To Work With Machine Learning
Big Data Analytics, Business Intelligence and the Mind of Sherlock Holmes
Banks, Risk Disclosure and Text Analytics
3 Organizations That Can See the Future with Predictive Analytics
How BI and Data Analytics Professionals Used Twitter in September


TAGGED:revolution r
Share This Article
Facebook Pinterest LinkedIn
Share

Follow us on Facebook

Latest News

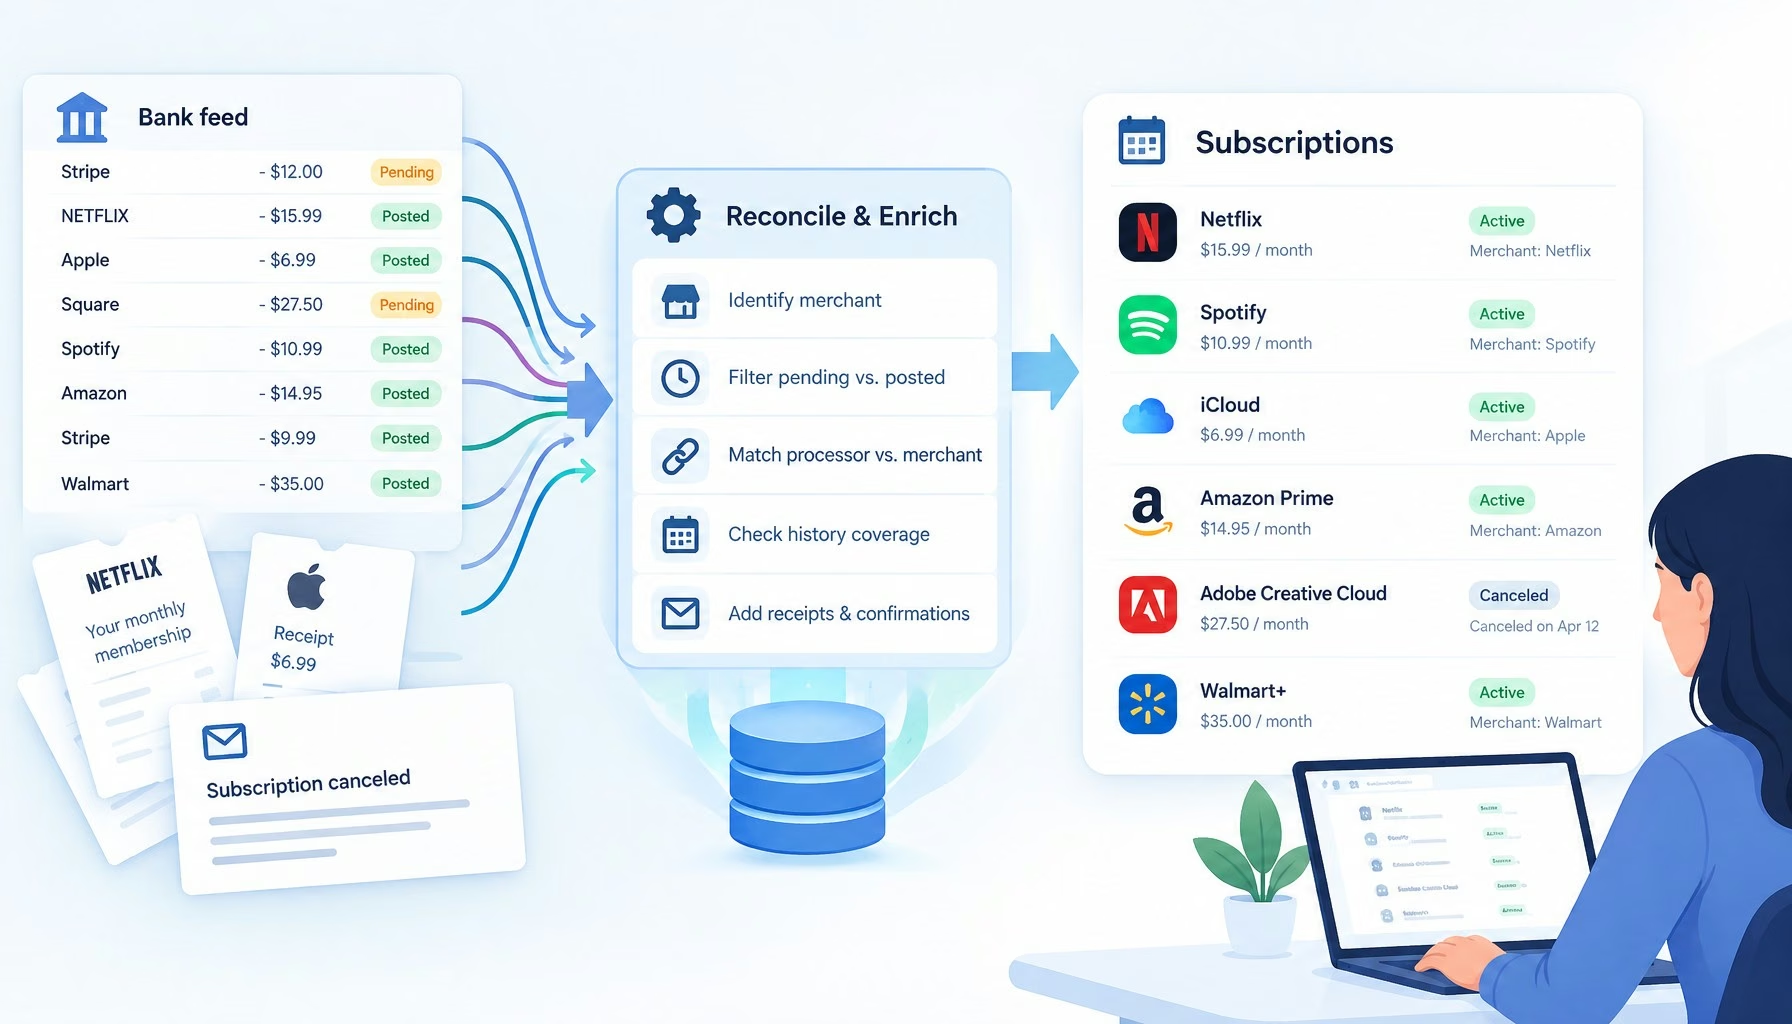
Flat editorial illustration: The article's core relationship is the gap between raw bank-feed records and reliable subscription i
Subscription Trackers Have a Transaction Data Problem
Big Data Exclusive
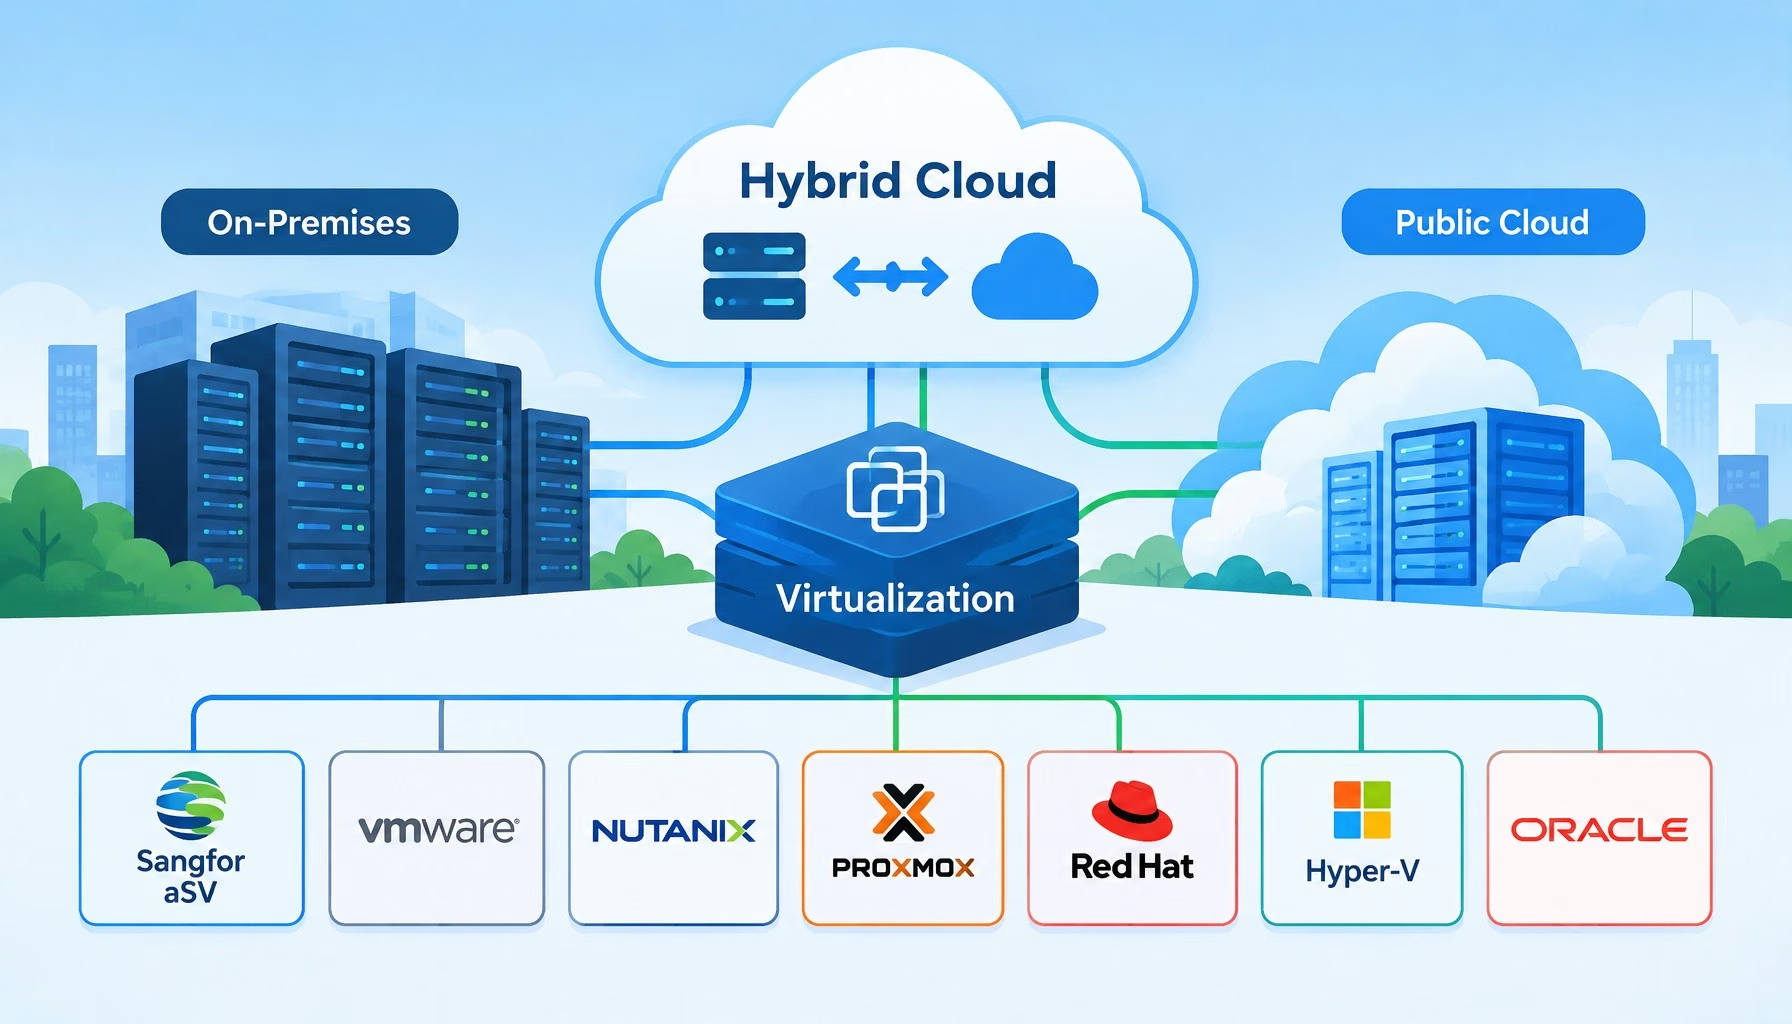
Flat editorial illustration: The article's core relationship is the hypervisor as the abstraction layer that makes hybrid cloud p
7 Best Virtualization Platforms for Hybrid Cloud Environments
Big Data
Flat editorial illustration: The article's core relationship is between aggregated workplace data (occupancy, environmental, feed
How Businesses Can Use Workplace Data to Create Better Office Environments
Big Data Business Intelligence Exclusive
Flat editorial illustration: The article's core relationship is the engineering transition from an AI prototype to a production-r
From AI Prototype to Production: Observability and Scalability Requirements for Data-Heavy SaaS Applications
Artificial Intelligence Exclusive

Stay Connected

1.2KFollowersLike
33.7KFollowersFollow
222FollowersPin

You Might also Like

What is R?
Data MiningPredictive Analytics

What is R?

8 Min Read

SmartData Collective is one of the largest & trusted community covering technical content about Big Data, BI, Cloud, Analytics, Artificial Intelligence, IoT & more.

How To Get An Award Winning Giveaway Bot
Big Data Chatbots Exclusive
AI chatbots
AI Chatbots Can Help Retailers Convert Live Broadcast Viewers into Sales!
Chatbots

Quick Link

  • About
  • Contact
  • Privacy
Follow US
© 2008-26 SmartData Collective. All Rights Reserved.
Welcome Back!

Sign in to your account

Username or Email Address
Password

Lost your password?