We use cookies, including third-party cookies from Google to serve personalized ads through AdSense, to operate this site and understand how it is used. By continuing to browse, you accept this use. See our Privacy Policy and Terms of Use for details, including how to opt out of personalized advertising.
Accept
SmartData CollectiveSmartData Collective
  • Analytics
    AnalyticsShow More
    Flat editorial illustration: The article is about joining public web signals with internal business metrics so BI teams can inter
    Alternative Data in BI: Bringing Public Web Data Into Your Dashboards
    23 Min Read
    Flat editorial illustration: The article is about automating the collection, preparation, and delivery of marketing data across p
    From Data to Dashboards: 5 Marketing Reporting Automation Software Picks
    12 Min Read
    Flat editorial illustration: The article contrasts passive follower totals with a behavioral path from attention and trust to cli
    Creator Analytics Beyond Follower Count: Seven Metrics That Measure Audience Behavior
    11 Min Read
    Flat editorial illustration: The article connects AI and marketing analytics with managerial judgment grounded in consumer behavi
    How an Online MBA in Marketing Connects AI and Data Analytics
    11 Min Read
    What Kind of Problem-Solving Distinguishes Data Analysts From Software Engineers -- AI-generated illustration
    What Kind of Problem-Solving Distinguishes Data Analysts From Software Engineers
    7 Min Read
  • Big Data
  • BI
  • Exclusive
  • IT
  • Marketing
  • Software
Search
© 2008-25 SmartData Collective. All Rights Reserved.
Reading: Making Sense of All the Big Data Around Us
Share
Notification
Font ResizerAa
SmartData CollectiveSmartData Collective
Font ResizerAa
Search
  • About
  • Help
  • Privacy
Follow US
© 2008-23 SmartData Collective. All Rights Reserved.
SmartData Collective > Analytics > Making Sense of All the Big Data Around Us
AnalyticsBig Data

Making Sense of All the Big Data Around Us

Rick Delgado
Rick Delgado
5 Min Read
big data
SHARE

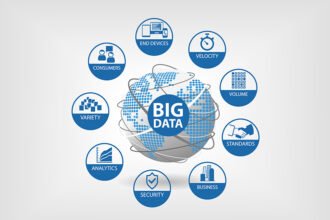
Many people are confused by the term big data, including businesspersons. No one can fault them; big data is a pretty confusing concept. The only consensus about big data is that the term ‘big data’ itself doesn’t have a specific definition. The simplest definition of big data is any set of raw data that’s too big for an Excel spreadsheet. Now that’s something most people can understand. That aside, the most important thing is to make sense of all the big data around us.

Contents
  • What Can Big Data Do for Your Business?
  • Tweak Your Business Model
  • Recruit and Manage Talent
  • Improve Operations
  • Check Out the Competition
  • Identify Trends

What Can Big Data Do for Your Business?

Big data is great. It’s a good thing to have access to in business. But what can it really do for your business? Well, a lot. But big data, in itself, isn’t much use to an average business person. As an entrepreneur, what you really need is insight. Fortunately, there are tools like an enterprise data catalog that you can use to make sense of this mountain of data at your disposal.

Big data analytics can be used to store, process, analyse, and draw conclusions from large sets of structured and unstructured data. Stream processing is a big data solution that can help you analyse and make sense of continuous data or data in motion, concurrently. It combines historical and continuous data to add context to it. Here are some of the ways you can make sense of the big data around you to improve your business:

Tweak Your Business Model

Data can lead you to exciting new ways of generating revenue thereby becoming a part of your business model. There are many ways a business can monetize data. For instance, you can sell data to your customers and third parties to create a new income stream. To earn from it, all you have to do is make sure that the data you generate provides value-added services for your consumers.

More Read

Data Management and the Navy: The Navy Virtualizes
Government’s Big Data Affected by Shutdown
Using Big Data in the Online Lending Process
Brains and Databases: An Obsession with Time Keeping
5 Step Process For Insightful Data Driven Business Decision Making

For instance, Facebook is provided for free to users, but the company still generates income. Facebook capitalizes on the vast amount of data on its users and avails some of it from free and some you have to pay for. Traditionally, Facebook has always generated income from advertising. You can tweak your business model and generate some income with big data.

Recruit and Manage Talent

Big data helps you engage existing staff, identify the best recruitment channels, and select the best candidates. You analyse personal development reviews, productivity data, absenteeism figures, etc. to gain recruitment and employee management insights. Most of this data is freely available for use.

Improve Operations

It can be used to improve business operations in every industry. Virtually, any business process that generates data can be optimized to increase efficiency. Some of the data processes include customer ordering systems, sensors on delivery vehicles, and machinery on a production line.

Check Out the Competition

Back in the day, you had to look around your competitors’ shops/websites or listen to industry gossip to know how they are faring. Today, you don’t even have to leave your desk to know what your rivals are up to. Big data has made financial and other important information readily available.

Identify Trends

It is getting guesswork out of the way when it comes to trend analysis and prediction. It’s extremely easy to work out what you are looking for. Every day, trending topics are flashing across Google, Twitter, and Facebook. You will be fine as long as you know what you are looking for.

Every business, irrespective of the industry, generates what may qualify as big data on a daily basis. The amount of data generated by both enterprises and SMBs (Small and Medium-Sized Businesses) is increasing at an astonishing rate. The problem is that most people don’t know what to do with data, but now you do. Make the most out of it.


TAGGED:big data analyticsdata analytics
Share This Article
Facebook Pinterest LinkedIn
Share
ByRick Delgado
Follow:
All things Big Data, Tech commentator, Enterprise Trends and every once in a while I write for @dell.

Follow us on Facebook

Latest News

Flat editorial illustration: The article is about joining public web signals with internal business metrics so BI teams can inter
Alternative Data in BI: Bringing Public Web Data Into Your Dashboards
Big Data Business Intelligence Exclusive Web Analytics
Flat editorial illustration: A SaaS-editorial scene showing product usage, support patterns, and renewal feedback informing a fle
Using Product Usage Analytics and Support Data to Build a B2B Product Roadmap
Business Intelligence Infographic
From Hiring To Payroll: Managing HR Data Across Business Systems -- AI-generated illustration
From Hiring To Payroll: Managing HR Data Across Business Systems
Big Data Business Intelligence Infographic
Flat editorial illustration: The article is about automating the collection, preparation, and delivery of marketing data across p
From Data to Dashboards: 5 Marketing Reporting Automation Software Picks
Analytics Business Intelligence Exclusive Marketing

Stay Connected

1.2KFollowersLike
33.7KFollowersFollow
222FollowersPin

You Might also Like

big data and business intelligence
AnalyticsBig DataBusiness Intelligence

Can Business Intelligence Answer the Questions Asked of it Without Big Data?

6 Min Read
Top 5 Reasons You Should Become a Data Analyst
Data Science

Top 5 Reasons You Should Become a Data Analyst

7 Min Read
5 Techniques to Make Your Big Data Analytics More Effective
AnalyticsBig DataData QualityExclusive

5 Techniques to Make Your Big Data Analytics More Effective

6 Min Read
How Data Analytics Tools Eliminate Business Owner Headaches
AnalyticsBig DataExclusive

How Data Analytics Tools Eliminate Business Owner Headaches

6 Min Read

SmartData Collective is one of the largest & trusted community covering technical content about Big Data, BI, Cloud, Analytics, Artificial Intelligence, IoT & more.

5 Great Tips for Using Data Analytics for Website UX
Big Data
From Bolts to Bots: How AI Is Fortifying the Automotive Industry
Artificial Intelligence

Quick Link

  • About
  • Contact
  • Privacy
Follow US
© 2008-26 SmartData Collective. All Rights Reserved.
Welcome Back!

Sign in to your account

Username or Email Address
Password

Lost your password?