

We use cookies, including third-party cookies from Google to serve personalized ads through AdSense, to operate this site and understand how it is used. By continuing to browse, you accept this use. See our Privacy Policy and Terms of Use for details, including how to opt out of personalized advertising.
Accept
SmartData CollectiveSmartData Collective
  • Analytics
    AnalyticsShow More
    Flat editorial illustration: The article is about joining public web signals with internal business metrics so BI teams can inter
    Alternative Data in BI: Bringing Public Web Data Into Your Dashboards
    23 Min Read
    Flat editorial illustration: The article is about automating the collection, preparation, and delivery of marketing data across p
    From Data to Dashboards: 5 Marketing Reporting Automation Software Picks
    12 Min Read
    Flat editorial illustration: The article contrasts passive follower totals with a behavioral path from attention and trust to cli
    Creator Analytics Beyond Follower Count: Seven Metrics That Measure Audience Behavior
    11 Min Read
    Flat editorial illustration: The article connects AI and marketing analytics with managerial judgment grounded in consumer behavi
    How an Online MBA in Marketing Connects AI and Data Analytics
    11 Min Read
    What Kind of Problem-Solving Distinguishes Data Analysts From Software Engineers -- AI-generated illustration
    What Kind of Problem-Solving Distinguishes Data Analysts From Software Engineers
    7 Min Read
  • Big Data
  • BI
  • Exclusive
  • IT
  • Marketing
  • Software
Search
© 2008-25 SmartData Collective. All Rights Reserved.
Reading: The Cloud Storage Wars in 2014 [INFORAPHIC]
Share
Notification
Font ResizerAa
SmartData CollectiveSmartData Collective
Font ResizerAa
Search
  • About
  • Help
  • Privacy
Follow US
© 2008-23 SmartData Collective. All Rights Reserved.
SmartData Collective > IT > Cloud Computing > The Cloud Storage Wars in 2014 [INFORAPHIC]
Cloud Computing

The Cloud Storage Wars in 2014 [INFORAPHIC]

Zach Taiji
Zach Taiji
2 Min Read
Image
SHARE

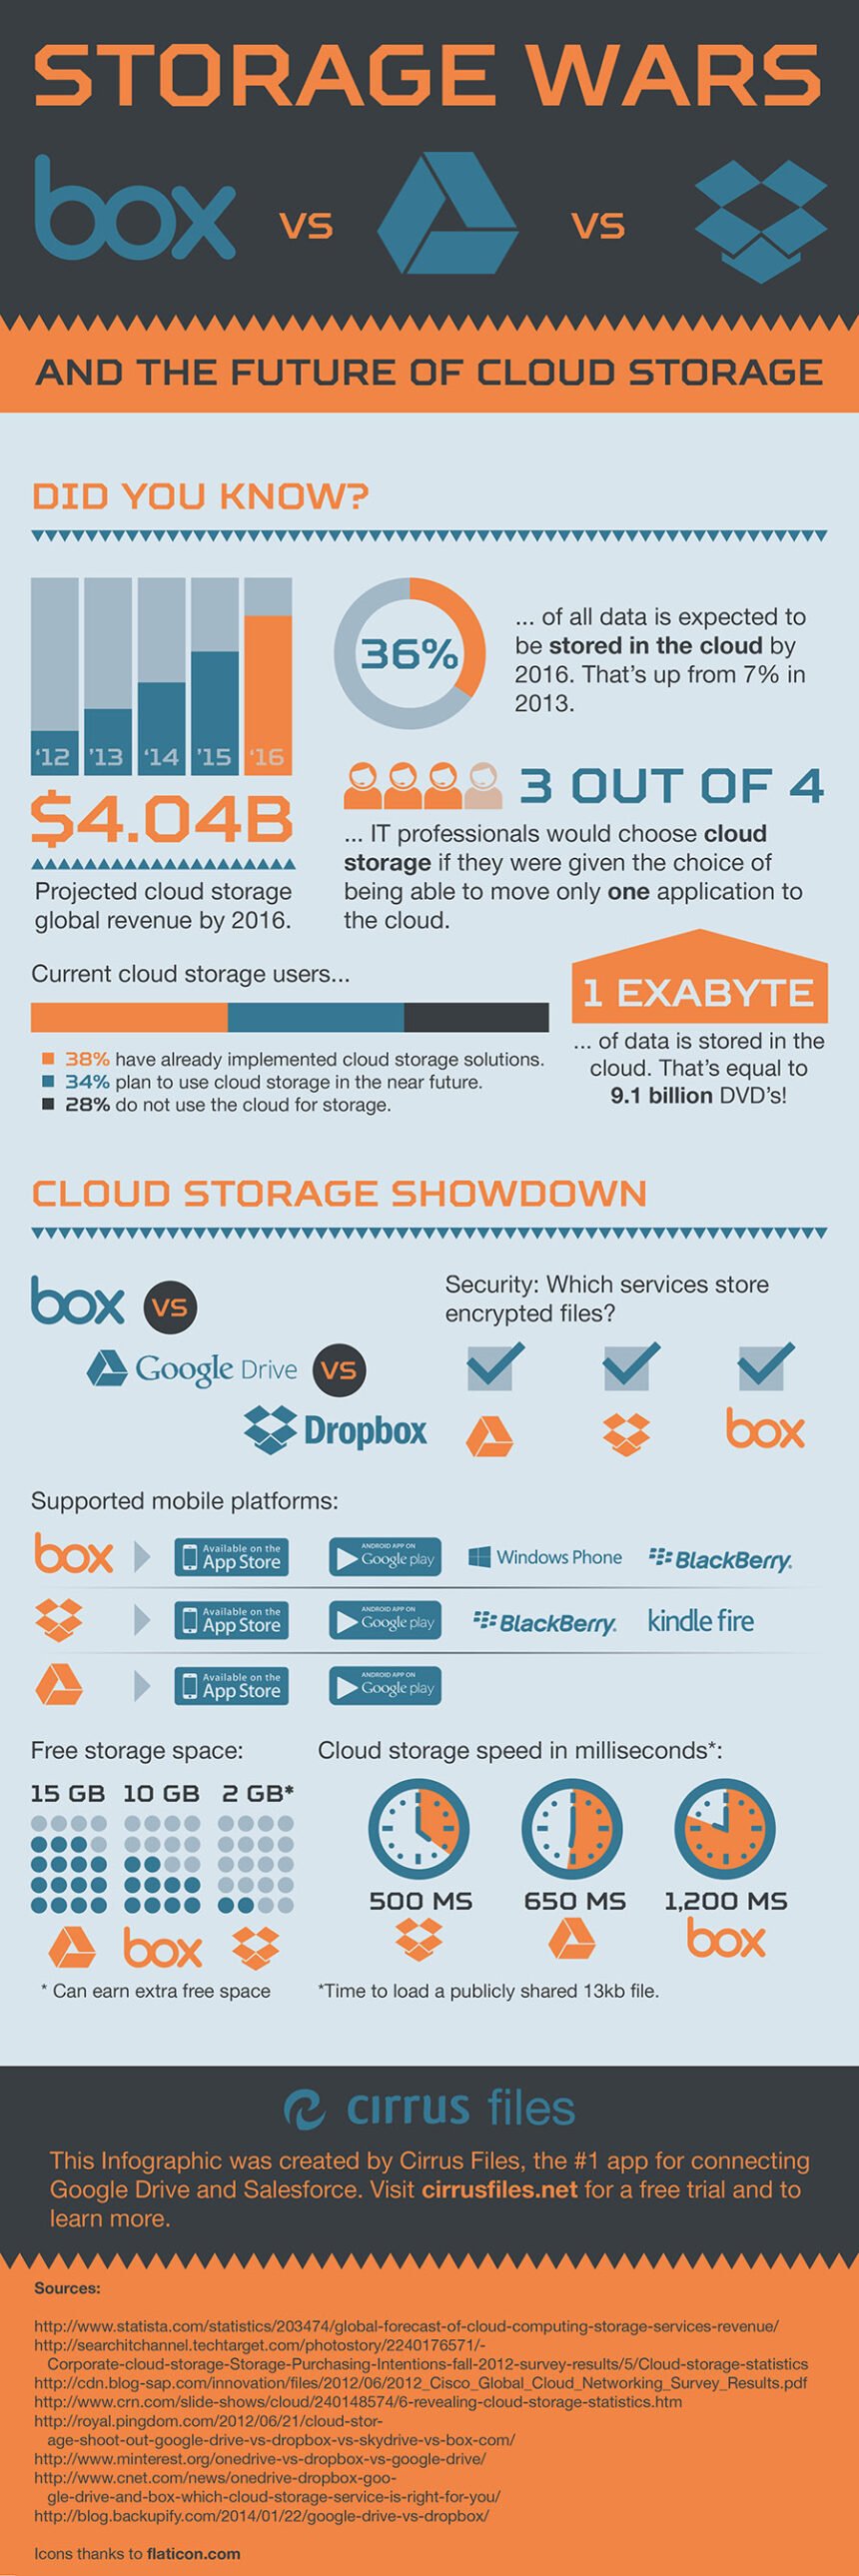
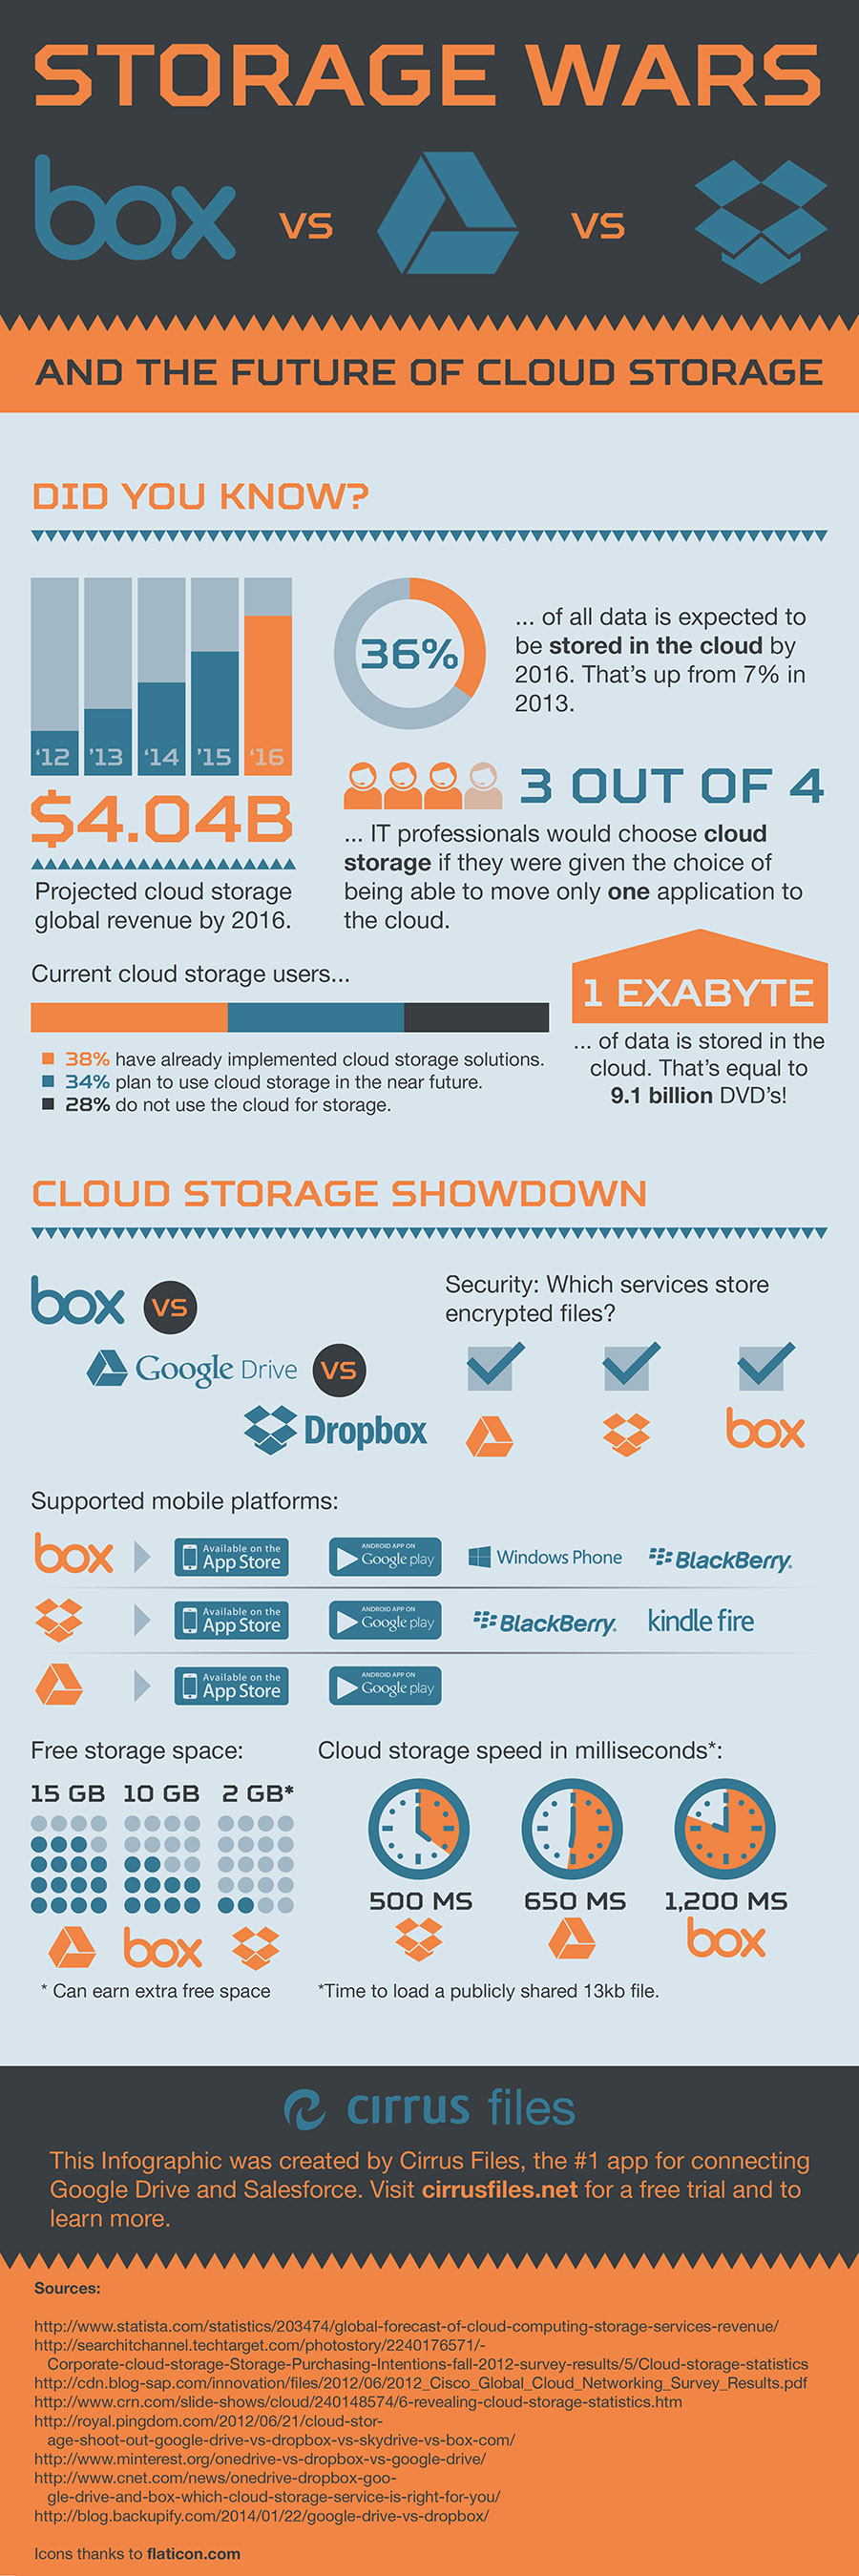
More people are starting to use cloud storage as an additional or even primary method to store and backup their data, thanks to the increasing reliability and advancement of cloud computing technologies. The technology is being used in almost every industry imaginable, from personal use to government (more than half of the US government has already moved to the cloud).

By 2016, the cloud storage industry is expected to generate over $4.04 billion in revenue, according to a forecast by Statista – and it’s only going to go up from there. More than 70% of businesses and IT professionals have already implemented cloud storage solutions or plan to in the near future, and 3 out of 4 IT professionals attribute cloud storage as the #1 reason for migrating to the cloud.

With an overwhelming amount of cloud storage solutions, it can be hard to choose which service is best for you – are security technologies like encryption important to you? Do you use a large amount of data? Or do you need to be able to upload and share files quickly? Take a look at the Infographic below, created by Cirrus Files which highlights more cloud storage industry statistics and compares three of the top competitors in the cloud storage wars: Box, Google Drive and Dropbox.

Image

More Read

Fine-Tuning Manufacturing Operations with Big Data and Hadoop
4 Guidelines for Protecting Your Data with Cloud Backup Software
The Secret BI / Big Data Playbook
Q & A on Cloud BI with Shawn Rogers
When is CAPEX Coming Back?
TAGGED:cloud storageinfographic
Share This Article
Facebook Pinterest LinkedIn
Share

Follow us on Facebook

Latest News

Flat editorial illustration: The article is about joining public web signals with internal business metrics so BI teams can inter
Alternative Data in BI: Bringing Public Web Data Into Your Dashboards
Big Data Business Intelligence Exclusive Web Analytics
Flat editorial illustration: A SaaS-editorial scene showing product usage, support patterns, and renewal feedback informing a fle
Using Product Usage Analytics and Support Data to Build a B2B Product Roadmap
Business Intelligence Infographic
From Hiring To Payroll: Managing HR Data Across Business Systems -- AI-generated illustration
From Hiring To Payroll: Managing HR Data Across Business Systems
Big Data Business Intelligence Infographic
Flat editorial illustration: The article is about automating the collection, preparation, and delivery of marketing data across p
From Data to Dashboards: 5 Marketing Reporting Automation Software Picks
Analytics Business Intelligence Exclusive Marketing

Stay Connected

1.2KFollowersLike
33.7KFollowersFollow
222FollowersPin

You Might also Like

The Cloud Doesn't Eliminate The Need For Data Recovery Software
Cloud ComputingExclusiveITSoftware

The Cloud Doesn’t Eliminate The Need For Data Recovery Software

6 Min Read
The Future of Big Data, Visualized [INFOGRAPHIC]
Big DataCulture/LeadershipData ManagementData Visualization

The Future of Big Data, Visualized [INFOGRAPHIC]

3 Min Read
A Powerful Combination: Big Data and Healthcare
Big Data

A Powerful Combination: Big Data and Healthcare

1 Min Read
Seven Steps to Heaven: Marketing Automation with a CRM System [INFOGRAPHIC]
Big DataBusiness IntelligenceCRMMarket ResearchMarketingSoftware

Seven Steps to Heaven: Marketing Automation with a CRM System [INFOGRAPHIC]

6 Min Read

SmartData Collective is one of the largest & trusted community covering technical content about Big Data, BI, Cloud, Analytics, Artificial Intelligence, IoT & more.

5 Great Tips for Using Data Analytics for Website UX
Big Data
ai chatbot
How AI Website Chatbots Improve Customer Support and Lead Generation
Chatbots Exclusive

Quick Link

  • About
  • Contact
  • Privacy
Follow US
© 2008-26 SmartData Collective. All Rights Reserved.
Welcome Back!

Sign in to your account

Username or Email Address
Password

Lost your password?