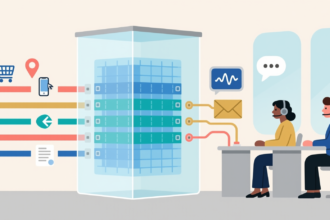

Most attribution arguments in e-commerce aren’t really about models. Marketing teams debate last-click versus data-driven, but the real reason the numbers can’t be trusted usually sits further down the stack: journeys that aren’t stitched together, touchpoints logged in five inconsistent formats, and a large share of ad exposure that never reaches the warehouse at all. Get the data layer right, and the choice of model becomes a fairly small decision. Get it wrong, and no algorithm will save the output.
- Step 1: Decide what a journey is
- Step 2: Stitch identities before you count anything
- Step 3: Build one touchpoint table
- Step 4: Deal with the impressions you can’t see
- Step 5: Choose a model you can explain
- Step 6: Validate against experiments
- Check the Attribution Pipeline Before Changing Channel Budgets
Ecommerce data teams can build reliable attribution by taking conversions from their order system, connecting customer identifiers, and standardizing touchpoints in one table. Apply a consistent lookback window, distinguish observed events from modeled exposure, and check channel credit against independent experiments. Server-side conversion capture and clean-room measurement address different gaps in that process.
This is a practical walkthrough of that data layer, written for the analysts and data engineers who end up owning it.
Step 1: Decide what a journey is
Attribution assigns credit for a conversion to the touchpoints that came before it. Before anything else, you need a working definition of both ends of that sentence.
The conversion should come from your order system or CRM, not from an ad platform pixel. Platform-reported conversions overlap with each other, and each uses its own counting rules. Your order table is the one source everyone agrees on.

The journey is the ordered set of touchpoints belonging to the same customer within a lookback window. For most e-commerce brands, a window of 30 to 90 days covers the realistic consideration period. Pick one window and apply it everywhere. Using different windows per channel is one of the quietest ways to bias the result.
Step 2: Stitch identities before you count anything
Clean rooms have moved from a topic the industry pontificated about on panels, to a proven and widely adopted technology,
Peter Nummerdor, VP in Peter NummerdorA customer who browses on mobile, clicks an email on a laptop, and buys in an app will look like three people unless you connect them. Identity stitching is the unglamorous core of attribution.
A workable approach layers several keys:
- Deterministic matches first: login IDs, hashed emails, and customer IDs captured at checkout or sign-in.
- First-party device identifiers next: server-side cookies or app instance IDs, linked to a customer the moment they authenticate.
- Session-level fallbacks last, for anonymous traffic that never logs in. These journeys are useful for aggregate patterns but shouldn’t be forced onto a known customer.
Keep an identity graph table that records which identifiers belong to which customer and when each link was made. Later, when a result looks strange, being able to trace how a journey was assembled saves days of debugging.
Use data clean rooms for measurement across company boundaries
Your identity graph records the customer links your team can establish. Measuring across publishers introduces another problem: connecting advertising activity to purchases without exchanging raw customer records. Data clean rooms support privacy-preserving collaboration for that work. Epsilon’s guide to clean-room measurement covers closed-loop attribution, incrementality, media mix modeling data feeds, and cross-publisher measurement. Those are distinct uses. A measurement result about audience overlap should stay separate from the deterministic links that assemble an individual customer’s journey.
Keep the output boundary explicit when you connect clean-room results to your attribution tables. If a result describes conversions for a group, retain it at that level instead of assigning those conversions to individual customers. Decentriq’s discussion of advertising clean rooms describes their role in privacy-safe advertising. For your team, the useful distinction is between a measured relationship across datasets and an identifier link you can trace to a specific customer. Record which measurement produced the result and which period it covers, so an analyst can reproduce the comparison without treating an aggregate finding as an observed touchpoint.
Step 3: Build one touchpoint table
Every interaction – whether an ad click, an email open, an organic visit, or an affiliate referral – should land in a single table with a consistent schema. At minimum:
| Field | Purpose |
|---|---|
| customer_id | Resolved identity from the identity graph |
| timestamp | Event time in UTC |
| channel | Standardized taxonomy (not raw UTM values) |
| campaign | Mapped from source systems |
| touch_type | Click, impression, visit, email, etc. |
| cost | Where available, for ROAS calculations later |
The channel taxonomy deserves more time than it usually gets. Raw UTM parameters are typed by people, and people are inconsistent. “facebook”, “Facebook_Ads”, “fb-paid”, and “meta” should all resolve to the same channel before anything is modeled. A maintained mapping table beats a pile of CASE statements.
Reconcile cross-platform claims against actual orders
Meta, Google, and TikTok can each claim credit for the same purchase. Adding their dashboard totals therefore gives you a count of platform claims, not a count of unique orders. Pantosource illustrates the discrepancy with ad platforms reporting 1,200 conversions while Shopify shows 650 sales. That example describes the reconciliation problem; it is not a benchmark for every store. Before comparing channel ROAS, match conversion records to the order system and apply the same conversion definition and reporting window across the comparison.
Keep platform claims separate from the orders they refer to. An order can have several claimed touchpoints while still contributing only one purchase to your conversion total. Where identifiers are available, use the order identifier to check whether the same purchase appears in several exports. Where only aggregate platform totals are available, preserve them as separate reported measures instead of fabricating order-level matches. Your warehouse-native attribution pipeline should calculate credit from the shared journey and order records. Leave the original platform totals available for reconciliation, so a dashboard disagreement can be traced to overlapping claims, different windows, or missing events.
Step 4: Deal with the impressions you can’t see
This is where most in-house builds stall. Clicks are easy to capture. Impressions from walled gardens such as Meta, TikTok, and Snapchat are not, because those platforms don’t share user-level exposure data. Yet for many e-commerce brands, paid social works largely through exposure. People see an ad, don’t click, and search for the brand a few days later.
Recover conversion signals without confusing them with impressions
Missing purchase events and missing ad impressions require different fixes. Digital Applied reports that browser pixels miss 30-50% of conversions and describes server-side tracking for Meta and TikTok using event_id deduplication and server-side Google Tag Manager (sGTM). The operational implication is to reconcile browser-captured purchases against your order records before trusting the conversion count. Treat the reported range as a reason to measure your own capture gap, not as an assumed correction factor. Sending conversion events from the server addresses missing conversion signals; it does not supply the user-level impression history absent from your warehouse.
When a purchase is sent through browser and server paths, keep its event_id consistent so those deliveries can be recognized as the same event. Check that identifier against the corresponding order before interpreting an increase in reported conversions as recovered data. Otherwise, a second delivery path can introduce another counting discrepancy. Cometly’s conversion API setup guide covers conversion tracking across Meta, Google, and TikTok. Keep the implementation checks separate from the exposure model: verify which purchase events reached each destination, then examine how channel credit changes. You still need an explicit approach for impressions you cannot observe.
Ignoring those impressions systematically overcredits search and direct traffic – the channels that catch demand others created. There are two broad ways to handle it:
- Aggregate modeling. Use platform-reported impression volumes over time and estimate their effect on conversions statistically, outside the user-level journey.
- Modeled user-level exposure. Estimate which journeys were likely exposed, based on targeting, reach, and timing, and insert those probable impressions into the touchpoint table. Some attribution platforms do this as a built-in step. Roivenue, for example, generates synthetic impressions for walled-garden channels so they can be weighed alongside observed clicks.
Whichever you choose, flag modeled touchpoints clearly in the table. Analysts should always be able to separate what was observed from what was estimated.
Step 5: Choose a model you can explain
With clean journeys in place, the modeling choice is the easier part. If you’re aligning stakeholders on terminology first, this guide to multi-touch attribution fundamentals is a useful shared reference. The main options:
- Rule-based models (linear, time-decay, position-based) are transparent and easy to audit, but the weights are arbitrary.
- Markov chain models estimate each channel’s contribution through its “removal effect”: how much the overall conversion rate would drop if that channel disappeared from every journey.
- Shapley value models borrow from cooperative game theory. They average each channel’s marginal contribution across every possible combination of channels.
Algorithmic models reflect the data better, but they’re harder to explain to a CMO. A common compromise is to run a transparent rule-based model alongside an algorithmic one and investigate wherever the two disagree sharply.
Step 6: Validate against experiments
Attribution results are estimates, and they should be checked against something independent. Geo holdouts, conversion lift studies, and planned budget pauses all produce causal reads for individual channels. If your model says paid social drives a large share of revenue but a regional holdout shows little change when it’s switched off, the model needs recalibrating, not defending.
Run at least one validation test per quarter on your largest channel. Over time, the gap between modeled and measured incrementality becomes your best indicator of whether the whole system can be trusted.
Check the Attribution Pipeline Before Changing Channel Budgets
Attribution is mostly a data engineering problem with a modeling step at the end. Stitch identities carefully, standardize touchpoints in one table, be honest about the exposure you can’t observe, and test the output against experiments. Teams that do this rarely end up arguing about the model, because the data underneath has already settled most of the questions.
A new server-side feed can change reported conversions before any budget changes. Before acting on the increase, trace a purchase through its order identifier, browser and server event_id, resolved customer, and attributed touchpoints. Check that it contributes one purchase to the conversion total. Then compare channel credit with modeled impressions included and excluded, keeping the lookback window fixed. If the recommendation changes sharply, inspect those estimated exposures before moving spend, and use the next holdout test to check the disputed channel.