We use cookies, including third-party cookies from Google to serve personalized ads through AdSense, to operate this site and understand how it is used. By continuing to browse, you accept this use. See our Privacy Policy and Terms of Use for details, including how to opt out of personalized advertising.
Accept
SmartData CollectiveSmartData Collective
  • Analytics
    AnalyticsShow More
    What Kind of Problem-Solving Distinguishes Data Analysts From Software Engineers -- AI-generated illustration
    What Kind of Problem-Solving Distinguishes Data Analysts From Software Engineers
    7 Min Read
    chatgpt image jul 21, 2026, 04 34 30 pm
    4 Core Benefits of Predictive Maintenance after Vibration Analysis
    10 Min Read
    How Does Data Mining Boost Customer Satisfaction in Logistics? Harnessing Analytics for Results -- AI-generated illustration
    How Does Data Mining Boost Customer Satisfaction in Logistics? Harnessing Analytics for Results
    11 Min Read
    chatgpt image jul 13, 2026, 04 23 45 pm
    How Data Analytics Helps Companies Improve User Engagement
    19 Min Read
    chatgpt image jul 13, 2026, 03 59 46 pm
    How Data Analytics Improves Multi-Location Search Strategies
    10 Min Read
  • Big Data
  • BI
  • Exclusive
  • IT
  • Marketing
  • Software
Search
© 2008-25 SmartData Collective. All Rights Reserved.
Reading: The Data Analytics of Harry Potter
Share
Notification
Font ResizerAa
SmartData CollectiveSmartData Collective
Font ResizerAa
Search
  • About
  • Help
  • Privacy
Follow US
© 2008-23 SmartData Collective. All Rights Reserved.
SmartData Collective > Analytics > The Data Analytics of Harry Potter
Analytics

The Data Analytics of Harry Potter

Brett Stupakevich
Brett Stupakevich
3 Min Read
The Data Analytics of Harry Potter
Illustrative image generated with OpenAI gpt-image-1.
SHARE

Author: Amanda Brandon
Spotfire Blogging Team

Early this morning fanatic fans bared witness to the end of an institution at the midnight premiere of the final movie in the Harry Potter blockbuster series. In celebration of this event, we thought it would be fun to explore the data analytics of Harry Potter for all you “data wizards.”

But first, so you don’t feel left out of  that late night frenzy check out this amateur video taken while waiting in line at a theater.


More Read

A year on: The promise of SAP HANA for Big Data analytics (Part Two)
Keep an Eye on the emerging Open-Source Analytics Stack
CRM Analytics Helps Content Creators Develop an Edge in a Saturated Market
Why You Should Already Have a Data Governance Strategy
How To Maintain Accurate Data Through Conversational Analysis?

Rowling Could Have Used Visual Analytics

In this handwritten spreadsheet, Harry Potter author J.K. Rowling maps out her plot for the fifth book in the series The Order of the Phoenix. We found this map on a film blog, and you have to blow it up to see the detail for which she visualizes the story.

As we said on Twitter earlier this week, TIBCO Spotfire could have been to Rowling what the Maurader’s Map was to Harry Potter.

Fun Data Fact

The Harry Potter series holds the world record for the fastest selling book of fiction in 24 hours.

Into the Pensieve with Data

This awesome infographic “Harry Potter and the Multi-Billion Dollar Empire,” courtesy of PiercedbyaLance.com showcases some of the key data the most successful movie/book franchise of all time.

Some of the analytics:

  • Harry Potter novels are available in 69 languages.
  • More than a dozen colleges and universities actually have courses related to Harry Potter including Oregon State’s “Find Your Patronus” and Yale’s “Christian Theology and Harry Potter.”
  • At the time of this post, Rowling (@jk_rowling) has 550,561 Twitter followers and just 7 tweets.

Box Office Prince

This infographic found on the newly launched Visual.ly, a data visualization community similar to Flickr, shows the key data analytics of the individual movies and a snapshot of how HP has aged over the decade-long film series.

Trends & Outliers to Consider in Opening Projections

And, in case you’re considering estimating the figures of the final HP opening weekend, here’s a discussion of the last seven films to give you some trends and outliers to consider.

Next Steps

  • Dress up as your favorite Harry Potter character and enjoy this historic event this weekend with your muggle friends and family.
  • While in full costume, check out the magic of easy and fast analytics software with our on-demand webcast “Intro to Spotfire 3.3.”

Share This Article
Facebook Pinterest LinkedIn
Share

Follow us on Facebook

Latest News

Flat editorial illustration: The article’s core relationship is between growing compute density and adaptable rack hardware that
6 Details That Make a Data Centre’s Server Room Easier to Scale
Best Practices Data Management Exclusive IT
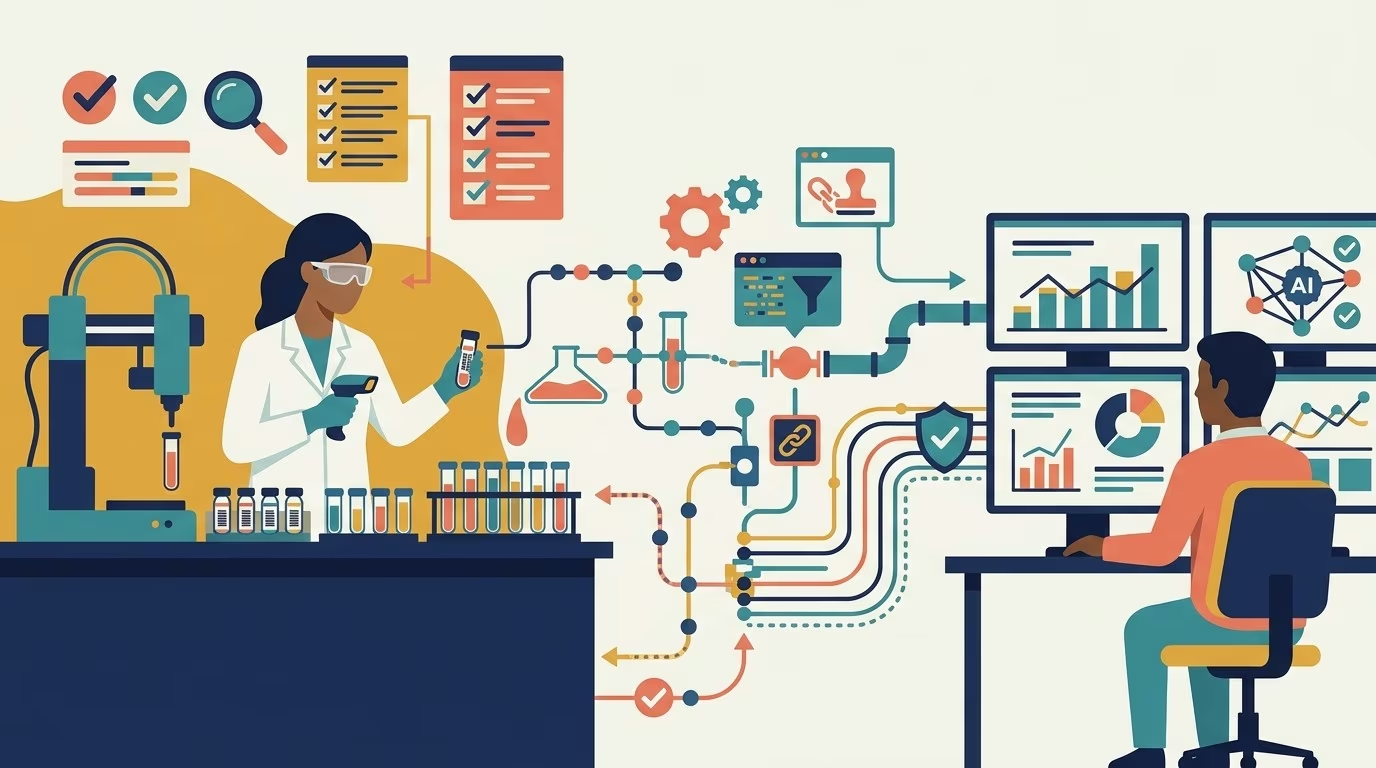
Flat editorial illustration: The article’s core relationship is a transfer of discipline from regulated laboratories to analytics
What Business Intelligence Teams Can Learn from Lab Data Governance
Business Intelligence Exclusive
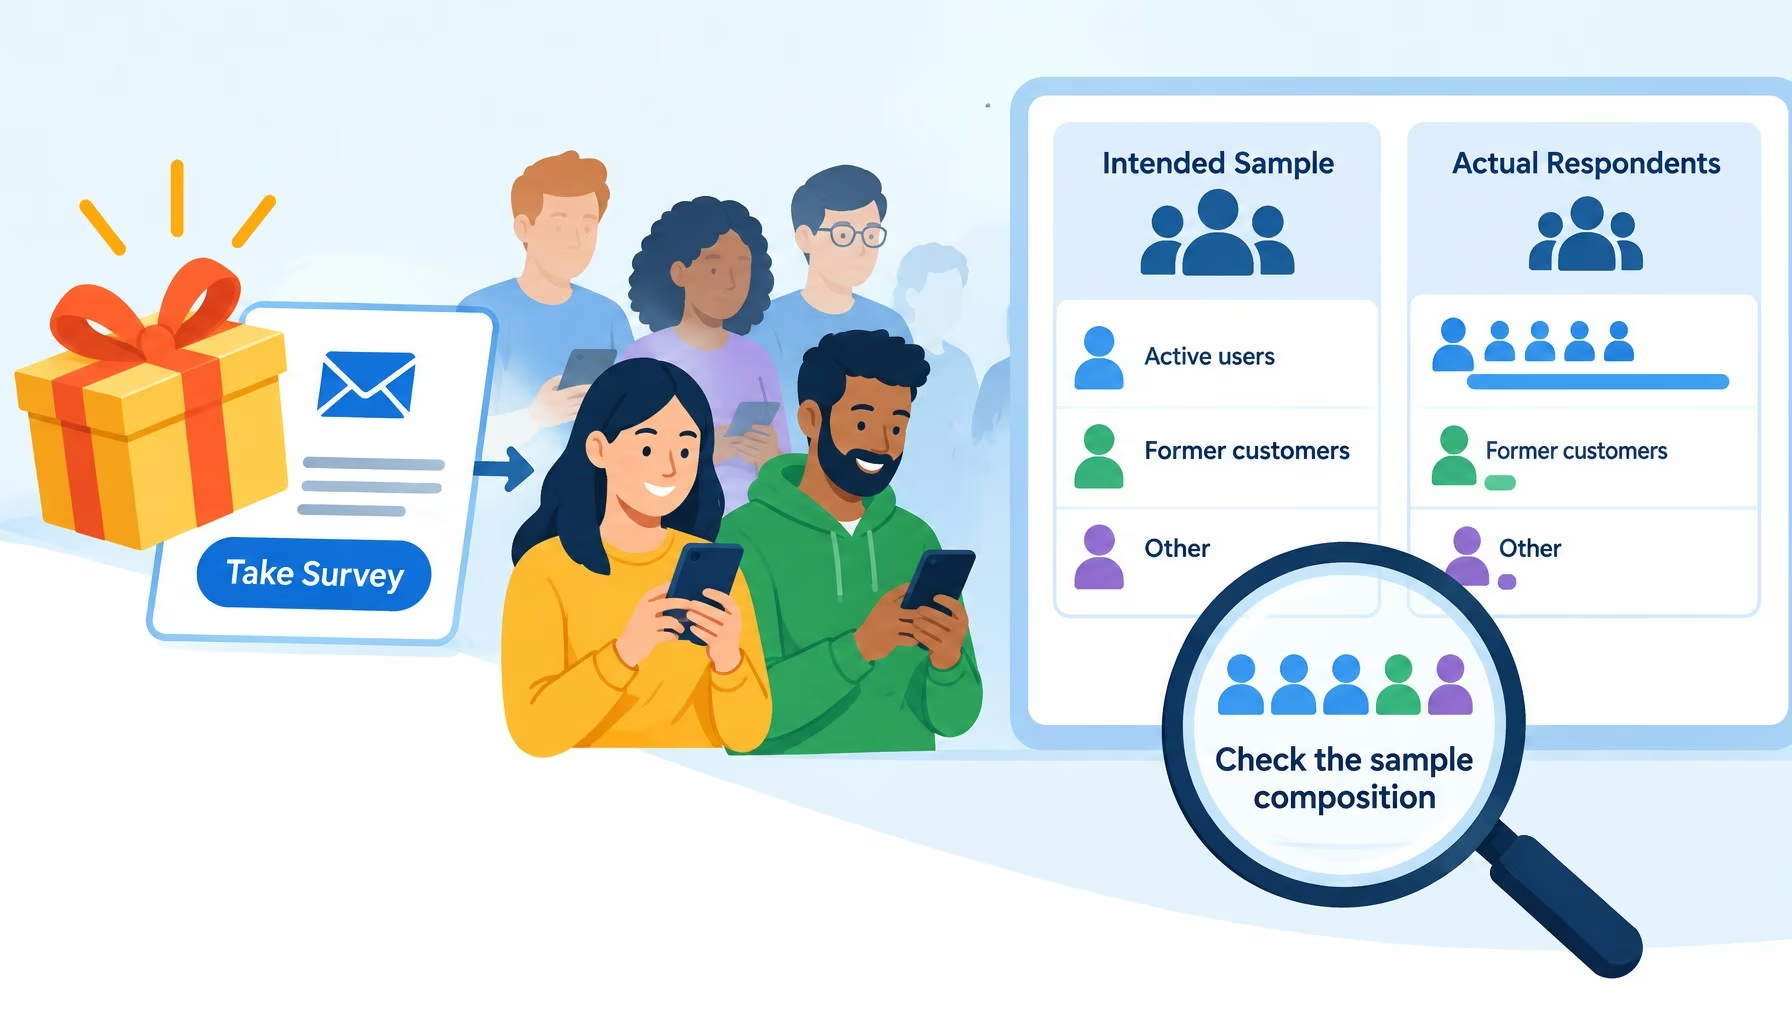
Flat editorial illustration: A guaranteed reward can raise participation while skewing the respondent pool toward active customer
Incentive-Driven Response Bias: Auditing Sample Composition Before You Trust Survey Data
Big Data Data Quality Exclusive
Flat editorial illustration: The article’s core relationship is observable blockchain activity becoming a trustworthy business me
Blockchain Dashboards Need Better Definitions, Not More Charts
Blockchain Exclusive

Stay Connected

1.2KFollowersLike
33.7KFollowersFollow
222FollowersPin

You Might also Like

6 Key Capabilities an Embeddable Analytics Software Should Deliver
AnalyticsBusiness IntelligenceData VisualizationSoftware

6 Key Capabilities an Embeddable Analytics Software Should Deliver

9 Min Read
5 Tools That Use Big Data For Social Media Optimization
AnalyticsBig DataExclusiveSocial Data

5 Tools That Use Big Data For Social Media Optimization

7 Min Read
Analytic Teams Are Rapidly Reaching Critical Mass
AnalyticsBig Data

Analytic Teams Are Rapidly Reaching Critical Mass

5 Min Read
Every User an Analyst - Bah, Humbug!
AnalyticsBusiness IntelligenceCulture/Leadership

Every User an Analyst – Bah, Humbug!

4 Min Read

SmartData Collective is one of the largest & trusted community covering technical content about Big Data, BI, Cloud, Analytics, Artificial Intelligence, IoT & more.

How To Get An Award Winning Giveaway Bot
Big Data Chatbots Exclusive
From Bolts to Bots: How AI Is Fortifying the Automotive Industry
Artificial Intelligence

Quick Link

  • About
  • Contact
  • Privacy
Follow US
© 2008-26 SmartData Collective. All Rights Reserved.
Welcome Back!

Sign in to your account

Username or Email Address
Password

Lost your password?