We use cookies, including third-party cookies from Google to serve personalized ads through AdSense, to operate this site and understand how it is used. By continuing to browse, you accept this use. See our Privacy Policy and Terms of Use for details, including how to opt out of personalized advertising.
Accept
SmartData CollectiveSmartData Collective
  • Analytics
    AnalyticsShow More
    Flat editorial illustration: The article is about joining public web signals with internal business metrics so BI teams can inter
    Alternative Data in BI: Bringing Public Web Data Into Your Dashboards
    23 Min Read
    Flat editorial illustration: The article is about automating the collection, preparation, and delivery of marketing data across p
    From Data to Dashboards: 5 Marketing Reporting Automation Software Picks
    12 Min Read
    Flat editorial illustration: The article contrasts passive follower totals with a behavioral path from attention and trust to cli
    Creator Analytics Beyond Follower Count: Seven Metrics That Measure Audience Behavior
    11 Min Read
    Flat editorial illustration: The article connects AI and marketing analytics with managerial judgment grounded in consumer behavi
    How an Online MBA in Marketing Connects AI and Data Analytics
    11 Min Read
    What Kind of Problem-Solving Distinguishes Data Analysts From Software Engineers -- AI-generated illustration
    What Kind of Problem-Solving Distinguishes Data Analysts From Software Engineers
    7 Min Read
  • Big Data
  • BI
  • Exclusive
  • IT
  • Marketing
  • Software
Search
© 2008-25 SmartData Collective. All Rights Reserved.
Reading: New Big Data Visualization Platforms Help You Optimize Decision Making
Share
Notification
Font ResizerAa
SmartData CollectiveSmartData Collective
Font ResizerAa
Search
  • About
  • Help
  • Privacy
Follow US
© 2008-23 SmartData Collective. All Rights Reserved.
SmartData Collective > Big Data > Data Visualization > New Big Data Visualization Platforms Help You Optimize Decision Making
Big DataData VisualizationExclusive

New Big Data Visualization Platforms Help You Optimize Decision Making

Ryan Kade
Ryan Kade
6 Min Read
New Big Data Visualization Platforms Help You Optimize Decision Making
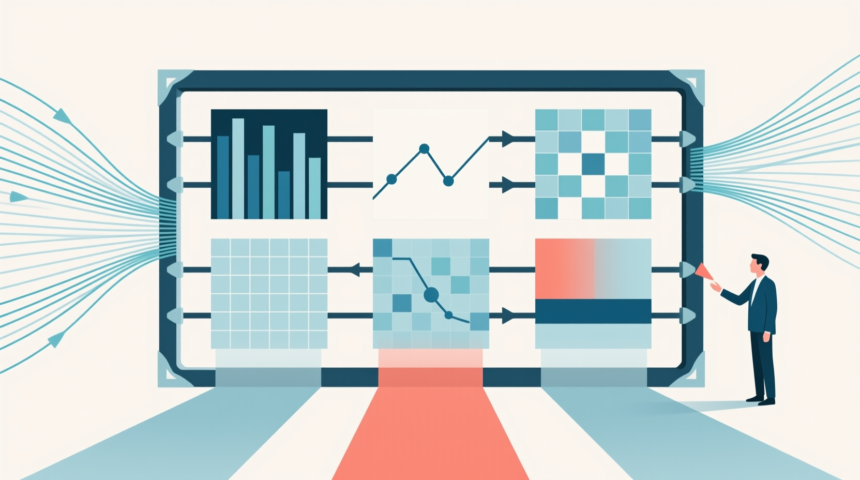
Illustration generated with Qwen Image.
SHARE

We have addressed a number of ways big data is changing industries across the economy. We have focused more heavily on some factors than others, but there are some universal changes that big data has created. Big data visualization is a more effective way to utilize this data for optimal performance.

Contents
  • What is the Role of Big Data Visualization in Decision-Making?
  • 1. Real-Time Data is Essential for Maximizing Customer Engagement
  • 2. Enhancing Operational Efficiency
  • 3. Enhancing Forecasting Using Predictive Analytics
  • 4. Enhance Decision Making Using Prescriptive Analytics
  • Big Data is Vital for Future Decision Making

What is the Role of Big Data Visualization in Decision-Making?

Maintaining a competitive edge

is vital for any business enterprise to survive in this ever increasingly competitive business environment. The future presents challenges that require business managers to tackle them in the present. Consequently, every decision made in the present has a profound impact on the future of every business firm. The rate at which a business responds to challenges now and in the future is a major determinant of its rate of success. Big data analytics have immense potential to help businesses in decision making and move the company into a realistic future. Therefore, it is essential for managers of companies to understand the concept of big data and how it can impact the activities of the organization. Here are some of the ways in which big data analytics/visualization platforms/software can facilitate better and timelier decision making.

1. Real-Time Data is Essential for Maximizing Customer Engagement

Customer service is one of the areas of business that are most affected by big data. Organizations use real-time data to get a better pulse of their customers and find ways to engage with them better. There are many ways that it can be applied. One of the most important is with the use of loyalty programs. A number of companies use big data to perform data storytelling applications. LVMH, BNP Paribas, and Total are just a few of these companies. These companies use the data collected from millions of consumers to generate actionable insights that can help these brands to enhance their profitability and customer loyalty.

More Read

The Cloud is Disrupting Project Management in the Construction Industry
How Brands Are Using Big Data & CRM Tools to Build Psychographic Profiles
What’s an IT Data Warehouse? And Why Do You Need One?
Understanding the Benefits And Risks Of Relying on AI
Bringing Big Data to a New Level: The Smart City of the Future [VIDEO]

2. Enhancing Operational Efficiency

Nowadays, organizations are leveraging big data in process automation optimizing selling strategies, as well as improving business efficiency. For instance, automobile manufacturers embed sensors in their vehicles on the production line to harvest data for future analysis and application. This ensures these companies are able to produce the highest quality vehicles on the market. Some companies also inform their customers about priority servicing or repairs.

3. Enhancing Forecasting Using Predictive Analytics

Predictive analytics is an area of big data analytics that has made it easier to identify tendencies, exceptions, and clusters while at the same time forecasting future trends. This makes it an extremely powerful tool for organizations. Big data analytics solution providers of InSight Analytics such as Toucan Toco employ various machine learning algorithms and statistical approaches to predict the probability of an event happening in the future. Big technology and retailing companies like Amazon and Wal-Mart utilize this high-in value form of analytics to predict future sales trends, customer purchase patterns, as well as customer behaviors.

4. Enhance Decision Making Using Prescriptive Analytics

In a nutshell, prescriptive data analytics are meant to help managers of organizations decide what needs to be done. Prescriptive analytics combine big data and artificial intelligence. The main objective is to prescribe the actions that need to be taken to address a foreseen future challenge. It is the next phase after predictive analytics to assist business managers understand the underlying reasons of problems and come up with the best possible course of action. These solutions share insights on potential outcomes and results that ultimately maximize key business metrics. Though the concepts of big data analytics cab seem as complex in nature, they can have a major impact on the future business success and overall operations when utilized by companies. Current trends show that an increasing number of business enterprises are appreciating big data solutions and planning to implement data analytics. Nevertheless, it is important for companies to choose the appropriate types of analytics solutions in order to improve their return on investment, improve service quality, and reduce operational costs. A company like Toucan Toco offers a range of data analytics solutions to serve a wide range of purposes and to meet the needs of any size of business enterprise.

Big Data is Vital for Future Decision Making

There are a number of reasons that decision making is going to be affected more strongly by changes in big data in the near future. Decision makers need to be aware of these changes and use it to their fullest potential. Some of the largest brands in the world are able to rely on big data to get the most out of their resources. They will invest in it even more heavily in the years to come.


TAGGED:big databig data visualizationdata visualizationDecision Making
Share This Article
Facebook Pinterest LinkedIn
Share
ByRyan Kade
Follow:
Ryan Kade is the editor overseeing contributed content at Smartdata Collective and contributes weekly column.

Follow us on Facebook

Latest News

Flat editorial illustration: The article is about joining public web signals with internal business metrics so BI teams can inter
Alternative Data in BI: Bringing Public Web Data Into Your Dashboards
Big Data Business Intelligence Exclusive Web Analytics
Flat editorial illustration: A SaaS-editorial scene showing product usage, support patterns, and renewal feedback informing a fle
Using Product Usage Analytics and Support Data to Build a B2B Product Roadmap
Business Intelligence Infographic
From Hiring To Payroll: Managing HR Data Across Business Systems -- AI-generated illustration
From Hiring To Payroll: Managing HR Data Across Business Systems
Big Data Business Intelligence Infographic
Flat editorial illustration: The article is about automating the collection, preparation, and delivery of marketing data across p
From Data to Dashboards: 5 Marketing Reporting Automation Software Picks
Analytics Business Intelligence Exclusive Marketing

Stay Connected

1.2KFollowersLike
33.7KFollowersFollow
222FollowersPin

You Might also Like

Using Safety Metrics and Incident Data to Reduce Construction Risk and Insurance Costs -- AI-generated illustration
Big DataExclusive

Using Safety Metrics and Incident Data to Reduce Construction Risk and Insurance Costs

10 Min Read
How Data Technology Disrupts Facebook Advertising At Its Core
Marketing

How Data Technology Disrupts Facebook Advertising At Its Core

13 Min Read
The Data Scientist is the New Product Manager
Uncategorized

The Data Scientist is the New Product Manager

5 Min Read
Big Data converging Data and Content
Business IntelligenceExclusive

Big Data converging Data and Content

5 Min Read

SmartData Collective is one of the largest & trusted community covering technical content about Big Data, BI, Cloud, Analytics, Artificial Intelligence, IoT & more.

The Art of Conversation: Enhancing Chatbots with Advanced AI Prompts
Chatbots
5 Great Tips for Using Data Analytics for Website UX
Big Data

Quick Link

  • About
  • Contact
  • Privacy
Follow US
© 2008-26 SmartData Collective. All Rights Reserved.
Welcome Back!

Sign in to your account

Username or Email Address
Password

Lost your password?