Cookies help us display personalized product recommendations and ensure you have great shopping experience.

By using this site, you agree to the Privacy Policy and Terms of Use.
Accept
SmartData CollectiveSmartData Collective
  • Analytics
    AnalyticsShow More
    data analytics
    How Data Analytics Can Help You Construct A Financial Weather Map
    4 Min Read
    financial analytics
    Financial Analytics Shows The Hidden Cost Of Not Switching Systems
    4 Min Read
    warehouse accidents
    Data Analytics and the Future of Warehouse Safety
    10 Min Read
    stock investing and data analytics
    How Data Analytics Supports Smarter Stock Trading Strategies
    4 Min Read
    predictive analytics risk management
    How Predictive Analytics Is Redefining Risk Management Across Industries
    7 Min Read
  • Big Data
  • BI
  • Exclusive
  • IT
  • Marketing
  • Software
Search
© 2008-25 SmartData Collective. All Rights Reserved.
Reading: BI & Analytic Trends of 2015: Storyboarding Becomes Best Practice for BI Design
Share
Notification
Font ResizerAa
SmartData CollectiveSmartData Collective
Font ResizerAa
Search
  • About
  • Help
  • Privacy
Follow US
© 2008-23 SmartData Collective. All Rights Reserved.
SmartData Collective > Uncategorized > BI & Analytic Trends of 2015: Storyboarding Becomes Best Practice for BI Design
Uncategorized

BI & Analytic Trends of 2015: Storyboarding Becomes Best Practice for BI Design

RickSherman
RickSherman
3 Min Read
SHARE

Business_valueThis is the second in the series of posts on best business value.

Business_valueThis is the second in the series of posts on best business value.

2)  Storyboarding becomes best practice for BI design

Typically BI applications are designed and built on a piecemeal basis. Either an IT person gathers the requirements for a specific dashboard or report, designs and builds it, and then hands it off to business people to figure out when and where to use it or the business people create their own dashboards or reports using self-service BI tools.  Regardless of who creates it, the deliverable is a specific BI dashboard or report.

More Read

The First Flinch…Amazon gives in just a little bit
Looking for ‘Bad Guys’ with Data Quality Tools
Overcoming Objections to a Data Governance Program
Facts not fears, confidence not certainty, critical thinking not wishful thinking
Software Agents and Rationality

The most successful BI programs have come to realize: (a) that the true business value of BI is derived from the action(s) taken as the result of the analysis enabled by the BI application and (b) most business decisions are based on a business process that involves multiple analyses (often in workflow). These two insights have resulted in a best practice to design BI applications to enable the multiple analyses and workflows of the business process, rather than focusing on piecemeal BI deliverables.

Rather than cranking out dozens or hundreds of individual dashboard or reports without a clear recognition as to how they all fit together, the best practice is to determine the data and analytical needs of the business process along with the workflow. Storyboarding is the preferred BI design technique to accomplish this.

As discussed in Chapter 14 BI Design and Development in my Business Intelligence Guidebook:

“The storyboarding technique is used extensively in the film industry to design both live action and animation movies. Sketches are created to represent scenes in the movie; they are then laid out in scene sequence, illustrating all the major changes in action.  Similarly, the BI storyboard lays out all the major actions that occur when business people are performing analysis in the BI application. The scenes that are used in the BI storyboard are each analytical process the business person performs in the BI application.

BI storyboards focus on the business user interaction of the analytical processes within the BI application. Storyboarding recognizes how business people actually work with BI applications such as a dashboard in order to gain insight into the business. Business people will typically perform several analyses, some of which are dependent on each other, in order to determine if they need to perform some action and what that action is. The storyboarding technique enables the BI designer gain a better perspective on how each type of analysis is related and enables the development a more effective layout.”

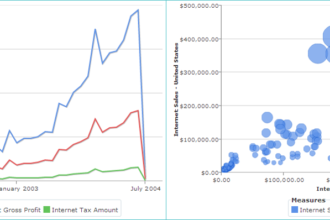
Storyboard example from the Business Intelligence Guidebook (see page 366):

Storyboard_example


TAGGED:bi
Share This Article
Facebook Pinterest LinkedIn
Share

Follow us on Facebook

Latest News

human verification tool for business
Human Verification Tools Help Make Smarter Data-Driven Decisions
Big Data Exclusive
ai in business
Recurring Revenue Strategies for the AI Business Era
Artificial Intelligence Exclusive
ai for playground safety
Using Data to Plan Safer, More Efficient Public Playgrounds
Big Data Exclusive
AI for cybersecurity
How AI Supports Modern Penetration Testing
Artificial Intelligence Exclusive

Stay Connected

1.2KFollowersLike
33.7KFollowersFollow
222FollowersPin

You Might also Like

A review of “The History of Business Intelligence” by Nic Smith

7 Min Read

3 Tips for a Successful BI Implementation

3 Min Read
3 free data sources for analytics and Business Intelligence
AnalyticsBest PracticesBig DataBusiness IntelligenceData ManagementDecision ManagementExclusiveNewsPredictive Analytics

3 Data Sources to Boost Analytics and Business Intelligence

6 Min Read

How to Choose Between Cognos and WebFOCUS?

8 Min Read

SmartData Collective is one of the largest & trusted community covering technical content about Big Data, BI, Cloud, Analytics, Artificial Intelligence, IoT & more.

AI and chatbots
Chatbots and SEO: How Can Chatbots Improve Your SEO Ranking?
Artificial Intelligence Chatbots Exclusive
ai in ecommerce
Artificial Intelligence for eCommerce: A Closer Look
Artificial Intelligence

Quick Link

  • About
  • Contact
  • Privacy
Follow US
© 2008-25 SmartData Collective. All Rights Reserved.
Welcome Back!

Sign in to your account

Username or Email Address
Password

Lost your password?