
We use cookies, including third-party cookies from Google to serve personalized ads through AdSense, to operate this site and understand how it is used. By continuing to browse, you accept this use. See our Privacy Policy and Terms of Use for details, including how to opt out of personalized advertising.
Accept
SmartData CollectiveSmartData Collective
  • Analytics
    AnalyticsShow More
    Flat editorial illustration: The article is about joining public web signals with internal business metrics so BI teams can inter
    Alternative Data in BI: Bringing Public Web Data Into Your Dashboards
    23 Min Read
    Flat editorial illustration: The article is about automating the collection, preparation, and delivery of marketing data across p
    From Data to Dashboards: 5 Marketing Reporting Automation Software Picks
    12 Min Read
    Flat editorial illustration: The article contrasts passive follower totals with a behavioral path from attention and trust to cli
    Creator Analytics Beyond Follower Count: Seven Metrics That Measure Audience Behavior
    11 Min Read
    Flat editorial illustration: The article connects AI and marketing analytics with managerial judgment grounded in consumer behavi
    How an Online MBA in Marketing Connects AI and Data Analytics
    11 Min Read
    What Kind of Problem-Solving Distinguishes Data Analysts From Software Engineers -- AI-generated illustration
    What Kind of Problem-Solving Distinguishes Data Analysts From Software Engineers
    7 Min Read
  • Big Data
  • BI
  • Exclusive
  • IT
  • Marketing
  • Software
Search
© 2008-25 SmartData Collective. All Rights Reserved.
Reading: Becoming A Data Scientist In 2021: Skills, Degrees, And Work Experience
Share
Notification
Font ResizerAa
SmartData CollectiveSmartData Collective
Font ResizerAa
Search
  • About
  • Help
  • Privacy
Follow US
© 2008-23 SmartData Collective. All Rights Reserved.
SmartData Collective > Big Data > Data Science > Becoming A Data Scientist In 2021: Skills, Degrees, And Work Experience
Big DataData ScienceJobs

Becoming A Data Scientist In 2021: Skills, Degrees, And Work Experience

Ryan Kade
Ryan Kade
6 Min Read
Becoming A Data Scientist In 2021: Skills, Degrees, And Work Experience
Illustration generated with ChatGPT.
SHARE

The future of data science jobs continues to be brighter than ever in 2020. Why? According to Glassdoor’s list of Best Jobs in America for the past four years, data scientist topped in terms of job demand, job satisfaction, and pay with an average base salary of more than $100,000 per year.

Contents
  • Overview
  • Level of Education
  • Previous Work Experience
  • Academic Degree
  • Coding Languages
    • Conclusion

So, who are the present-day data scientists and what does it take to become one? Our friends at 365 Data Science used public data on of 1,001 LinkedIn professionals including junior, experts, and senior data scientists to answer these questions.

40% of the surveyed data scientists are currently employed in the United States; 30% of the sample is based in the UK; 15% work in India; and 15% come from a collection of other countries.

50% of the cohort is currently employed at a Fortune 500 company, while the remaining 50% work in a non-ranked company.

More Read

Examples of Using Kanban Boards with Data Visualization Tools
How to Think Bigger With Big Data
Selling the Business Benefits of Data Quality
How Data Security Remains More Than Just About IT Safeguards
Hadoop Toolbox: When to Use What

So, let’s take a look at what the data has to say.

Overview

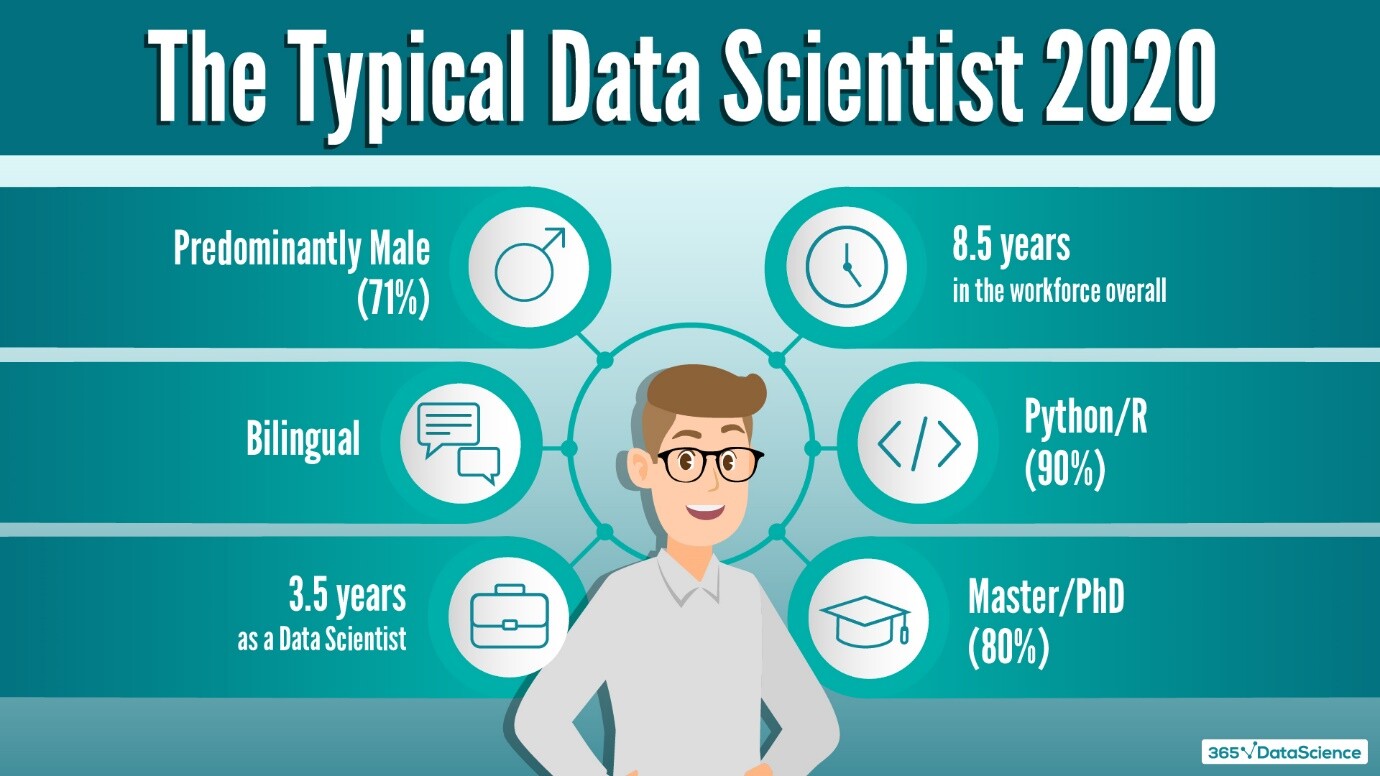
According to the research, there are twice as many male data scientists than there are female. Usually, they speak two languages – most often English and their mother tongue; four out of five have at least Master’s Degree; and it takes 8.5 years of overall work experience to become a data scientist. Nine out of ten use Python or R and about 80% of the cohort holds at least a Master’s degree. Furthermore, the typical data scientist in 2020 has held this prestigious title for an average of 3.5 years.
becoming a data scientist

Level of Education

Education is one of the 3 main components of most resumes. That makes perfect sense, as educational background demonstrates your expertise to your future employers, especially when you lack years of professional experience.

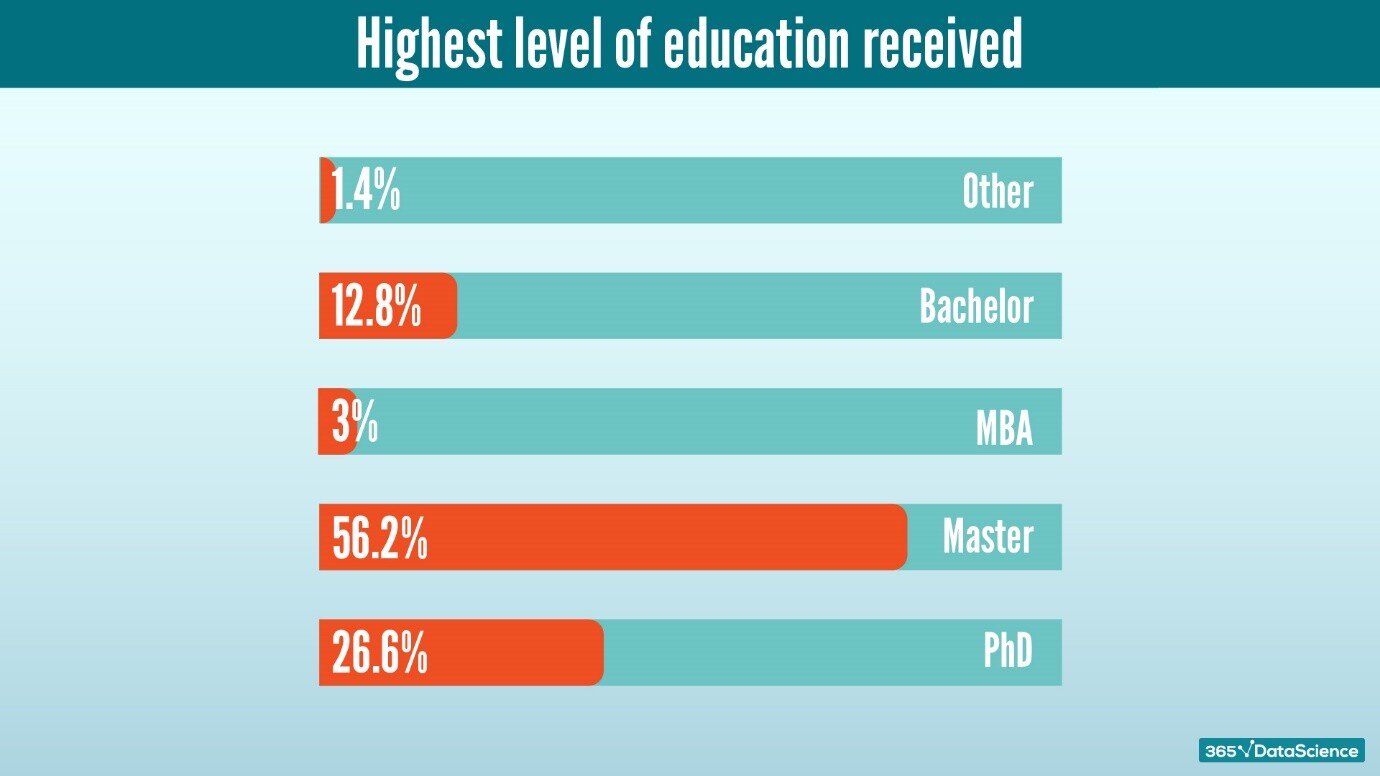
According to our data, the typical data scientist in 2020 holds a Bachelor (13%), a Master’s degree (56%), or a Ph.D. (27%) as their highest academic qualification. Yes, data science requires an advanced level of expertise. So, despite the fact that the data science field welcomes candidates with a graduate degree, a Master’s will definitely increase your chances of success. What about the Ph.D. degree? Well, judging by the numbers, it’s more of a bonus than a prerequisite. That explains why its percentage has remained approximately the same, based on the research in the past 3 years
becoming a data scientist

Previous Work Experience

Based on the sample, more than half of the currently employed data scientists were already on the job. 11% started as a data analyst. The rest came from Academia (8.2%), started as an Intern (7%), an IT (2.4%), a Consulatant (3.8%) or an Engineer (2.7%). And 12.5% transferred from other lines of employment.

Academic Degree

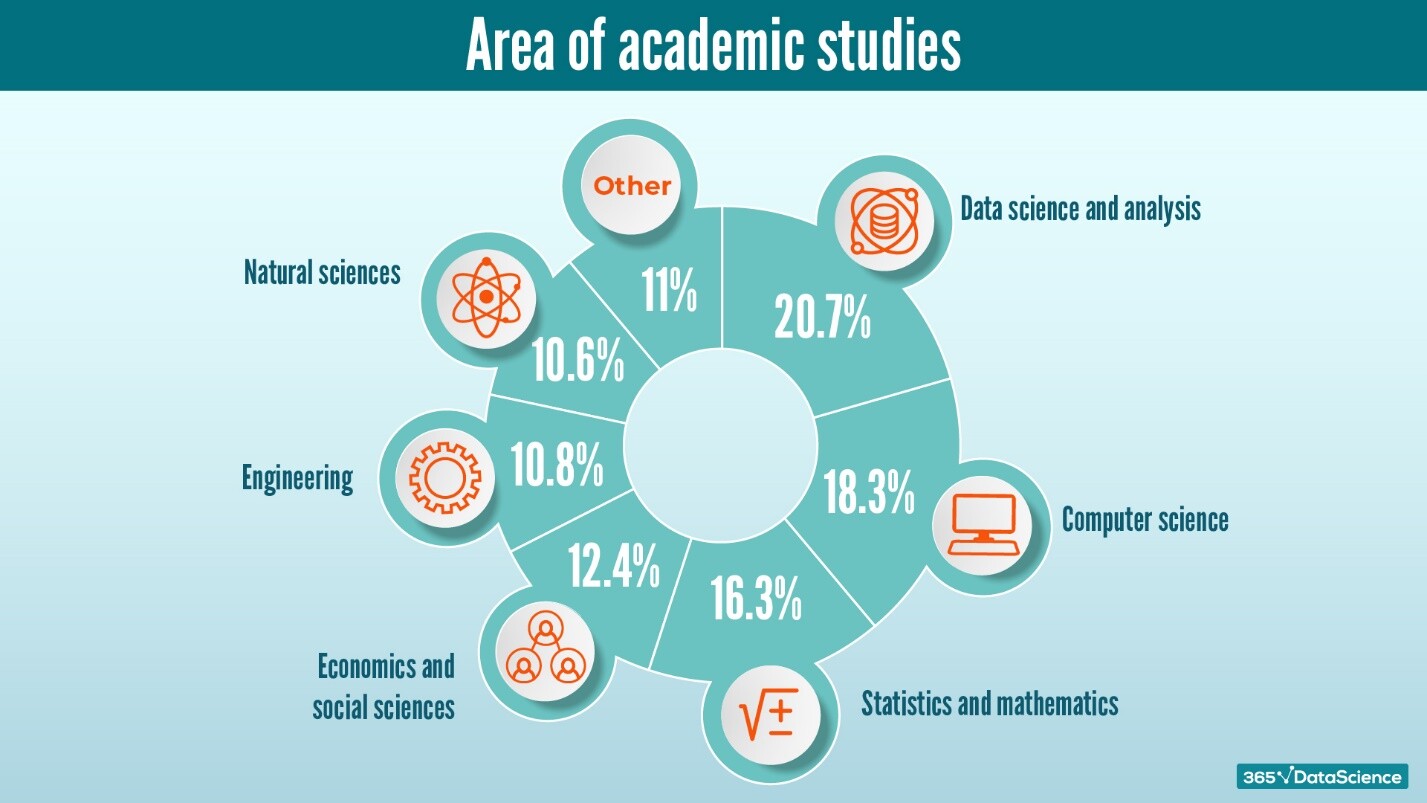
Data showed that Data Science and Analysis, comprising 21% of data scientists, is the degree that’s most likely to get you into data science in 2020, followed by the previous leader Computer Science (18.3%) and the traditional Statistics &Mathematics (16.3%).
becoming a data scientist

It’s true that data scientists come from various backgrounds. However, no single degree can prepare a person for a real job in data science.

That’s why, it shouldn’t come as a surprise that data scientists rely heavily on self-preparation. In fact, 41% of the sample included an online course in their LinkedIn profile. And that’s remained a consistent trend over the past two years (40% in 2018 and 43% in 2019).

Coding Languages

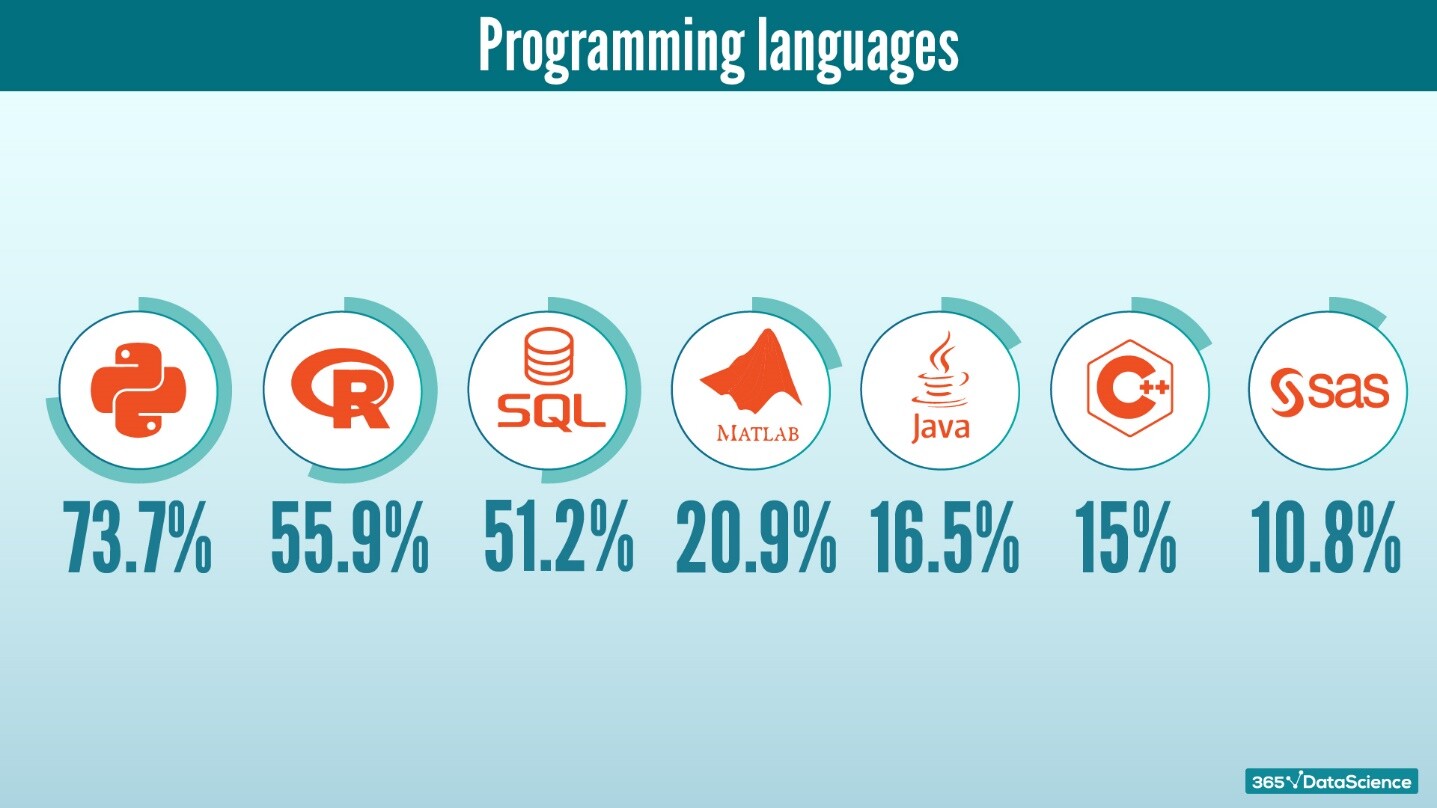
74% of the cohort uses Python, 56% are proficient in R, and 51% have good command of SQL. In terms of popuarity, SQL has grown by 40% since 2019 (36%), thus moving closer to R.

When it comes to Fortune 500 companies and programming languages, the overall usage of Python and R shows that large companies are rethinking the organization of their data. Although open source frameworks can be unorganized, unlike Matlab and C, more and more companies nowadays are turning to the user-friendly Python and R.

What about coding languages and country of employment? In 2020, Python is the undisputed king of coding language in all countries reflected in the survey. SQL seems unconcerned by Python’s reign and has even grown in popularity compared to previous years.
becoming a data scientist

Conclusion

Data speaks louder than words. And, according to the numbers, data science is thriving and continues to evolve. What’s more, in 2020, universities are starting to catch up with the growing demand by expanding their scope of education and relevant degrees.

However, you never know what the future has in store for data science in the next 2-5 years. So, if you want to stay up-to-date with the latest developments, you can follow the 365 Data Science blog for more career resources.


TAGGED:data science careerdata science careersData Scientist
Share This Article
Facebook Pinterest LinkedIn
Share
ByRyan Kade
Follow:
Ryan Kade is the editor overseeing contributed content at Smartdata Collective and contributes weekly column.

Follow us on Facebook

Latest News

Flat editorial illustration: The article is about joining public web signals with internal business metrics so BI teams can inter
Alternative Data in BI: Bringing Public Web Data Into Your Dashboards
Big Data Business Intelligence Exclusive Web Analytics
Flat editorial illustration: A SaaS-editorial scene showing product usage, support patterns, and renewal feedback informing a fle
Using Product Usage Analytics and Support Data to Build a B2B Product Roadmap
Business Intelligence Infographic
From Hiring To Payroll: Managing HR Data Across Business Systems -- AI-generated illustration
From Hiring To Payroll: Managing HR Data Across Business Systems
Big Data Business Intelligence Infographic
Flat editorial illustration: The article is about automating the collection, preparation, and delivery of marketing data across p
From Data to Dashboards: 5 Marketing Reporting Automation Software Picks
Analytics Business Intelligence Exclusive Marketing

Stay Connected

1.2KFollowersLike
33.7KFollowersFollow
222FollowersPin

You Might also Like

Essential Branding Guidelines For Aspiring Data Scientists
Data ScienceExclusive

Essential Branding Guidelines For Aspiring Data Scientists

5 Min Read
How Do I Become a Data Scientist?
Uncategorized

How Do I Become a Data Scientist?

10 Min Read
Are Data Scientists the Next Masters of the Universe?
CommentaryCulture/LeadershipData WarehousingExclusiveHadoopMapReducePredictive AnalyticsRisk ManagementUnstructured Data

Are Data Scientists the Next Masters of the Universe?

5 Min Read
What Is a Data Scientist (and What Isn't)?
Hadoop

What Is a Data Scientist (and What Isn’t)?

7 Min Read

SmartData Collective is one of the largest & trusted community covering technical content about Big Data, BI, Cloud, Analytics, Artificial Intelligence, IoT & more.

AI chatbots
AI Chatbots Can Help Retailers Convert Live Broadcast Viewers into Sales!
Chatbots
The Art of Conversation: Enhancing Chatbots with Advanced AI Prompts
Chatbots

Quick Link

  • About
  • Contact
  • Privacy
Follow US
© 2008-26 SmartData Collective. All Rights Reserved.
Welcome Back!

Sign in to your account

Username or Email Address
Password

Lost your password?