There is an emerging genre of BI tools built specifically for business users to perform visual data discovery. The user interfaces are designed to be intuitive and the features simple. These software products are meant to require little if any training. Architecturally, many provide in-memory analysis for high performance.
There is an emerging genre of BI tools built specifically for business users to perform visual data discovery. The user interfaces are designed to be intuitive and the features simple. These software products are meant to require little if any training. Architecturally, many provide in-memory analysis for high performance.
Of course, these “exploration” tools are also not intended to be full enterprise BI platforms. Instead, they are complementary to more robust products. You will not replace your existing BI products (SAP Business Objects, IBM Cognos, IBI WebFOCUS, MicroStrategy, etc.) with the limited scope of visualization software but you might consider supplementing them.
Competitive Vendors
The main data exploration products on the market today include:
- QlikView ($204 million revenue in 2011)
- Spotfire ($105M 2011) acquired by Tibco in 2007
- Tableau ($62M 2011)
- ADVIZOR Solutions ($10M?) which is also sold as WebFOCUS Visual Discovery

Tibco’s Spotfire is the old grand-daddy in this list and was quickly overtaken by the new kids on the block: QlikView from Sweden and Tableau from the Silicon Valley of the United States.
While QlikTech’s revenue reporting for QlikView appears much higher than that of Tableau’s, the job statistics imply that Tableau is in much higher demand.
Tableau to be the Winner?
Tableau arose out of a Stanford University research project from 1997 to 2002, and was spun off as a company in 2003. (Keep in mind that Jim Goodnight started SAS as a small college project which he later grew into a multi-billion dollar mega-software vendor.)
As part of a Department of Defense initiative, PhD candidate Chris Stolte created a “Visual Query Language” to explore large multi-dimensional databases. As luck would have it, Stolte’s university mentor was Pat Hanrahan, a founding employee of Pixar.
Together, they created what has been called “a kind of high powered, highly visual Excel,” which is a really good way of explaining the innovative software product. One of their first interested partners was Essbase, which makes sense. A common user interface for the Essbase cube was Excel, and Tableau was a nice next-generation version of that.
Tableau is the type of visual analytics software that Microsoft itself should have added to Excel.
The main Tableau products include:
- Tableau Desktop (authoring/publishing tool)
- Tableau Server (web hosting component)
- Tableau Reader (web viewing tool)
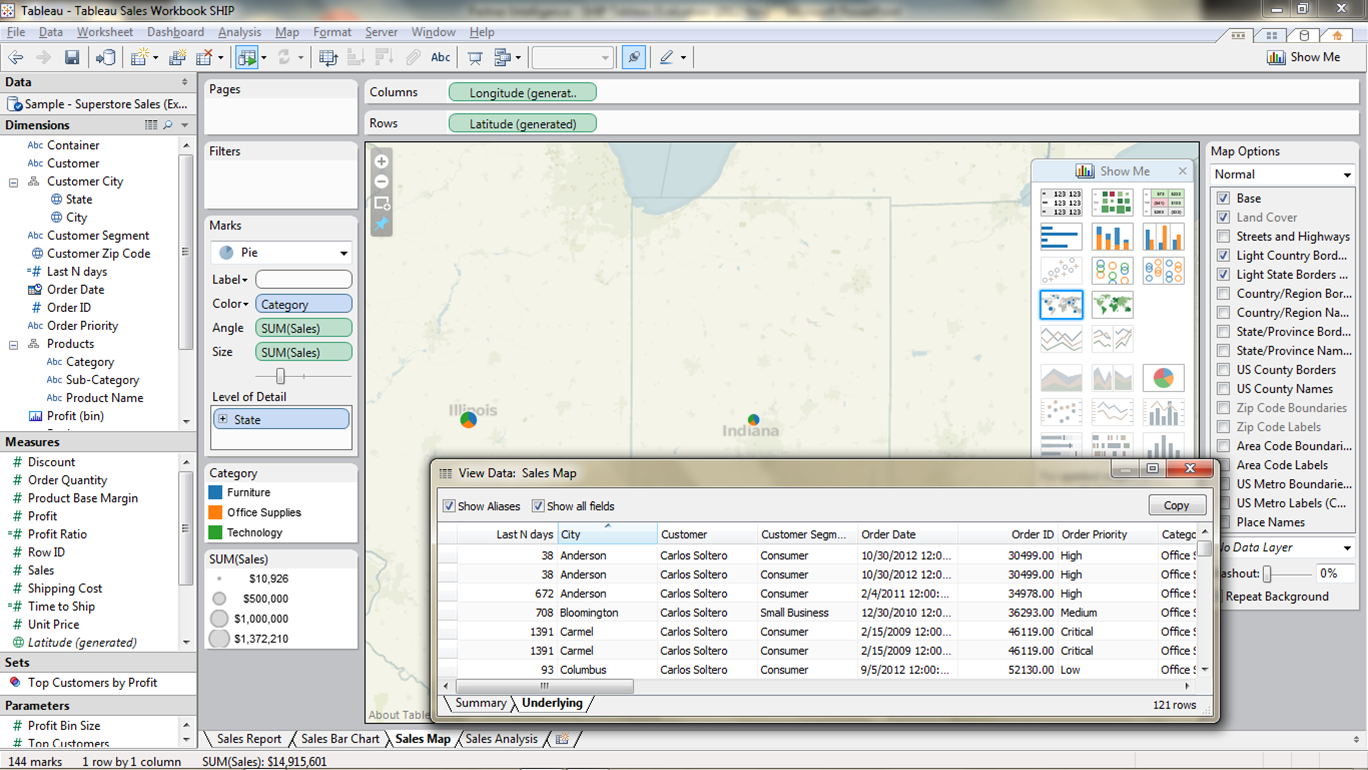
Tableau Desktop is an Excel spreadsheet hopped up on visualization steroids. Based on selections, Tableau points out to the user the “best practices” for visually displaying data.
Several of about twenty-four “Show Me” options light up for the user. Simply clicking on one, such as a geographic map or a stacked bar chart, does all of the work. There is no coding and no macros, just an easy to use graphical interface.
Within an hour after downloading a Windows desktop copy, I had used one of their accompanying demo files to generate a report, pie chart, bar chart, and geographic map.
The full version of Tableau Desktop allows access to a variety of databases and publishing capabilities while the “Personal Edition” works only with desktop flat files and spreadsheets. You can easily download copies of Tableau Desktop for one or two thousand US dollars per user license (for Personal and Professional Editions, respectively).
Why Not Tableau?
I will address Tableau’s enterprise web-based and mobile usage in a later blog but for departmental desktop usage, there are few hurdles to using Tableau.
If you have “spreadsheet jockeys” trying to perform data visualization with just Excel, then Tableau is a perfect holiday gift.
If your organization has a formal software development group anxious to control BI, however, then handing out desktop tools may not be a popular option. Controlling one version of the truth becomes harder when business users create their own BI fiefdoms.
But Business Intelligence is a strange animal and IT organizations often seem unable to control it. Few want to be the BI zookeeper. If so, responsibility for quality BI moves over to the business.
Organizations that rely upon end-user spreadsheets for reporting and analytics will bring in Tableau Desktop without much consideration.



 Tibco’s Spotfire is the old grand-daddy in this list and was quickly overtaken by the new kids on the block: QlikView from Sweden and Tableau from the Silicon Valley of the United States.