Delta-R’s product onRules is Java-based, service oriented application. Based on open source like the Spring, Hibernate, Java Server Faces r UI, Groovy for scripting etc. It is fully web based – thin client – and the resulting services are deployed as web services. It is available in English and Spanish.
The software starts with a tree/pane metaphor. The software has four main blocks of functionality – Administration, R-Dfine, R-Control (batch and unit testing) and R-Dcide (execution of web service, logging and statistics).
Administration handles Security, Domains (logical structure of the company using the product) and Scenarios. The Domains allow the different parts of an organization to see/have access to different elements – a typical tree structure with control rippling down. Some organizations use a development structure – QA, test, production – to manage their domains. Scenarios are workspaces. You can have as many as you want but only one can be active at a time. Scenarios can be promoted from one domain to another. Scenarios can be managed for future use (development), current use (read-only and deployed) and then archived when retired. Editing can only be done to future Scenario. You can copy the active one to a draft scenario and then load it to be the active scenario and start editing.

R-Dfine handles the data dictionary (variables or terms), policies, rules and data sources. The data dictionary is the basic vocabulary for the scenario. Variables are part of groups and can be constrained by Values (ranges, lists, codes etc). Variables can be mapped to outside data or can be internal use only. All variables, even internal variables like the output from a scorecard, must be defined.
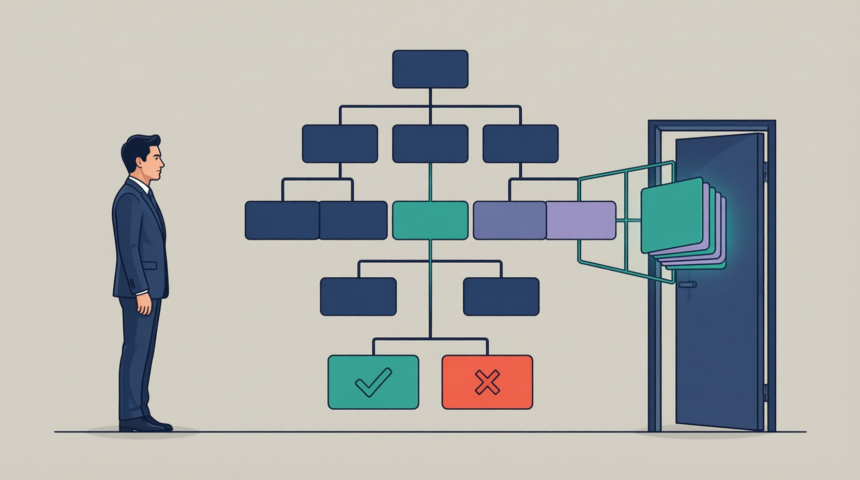
Policies are the main objects around which everything revolves. These are basically decisions and for each there is a flow – a decision flow. This has a nice drag and drop interface for defining the flow and each node can be one of the kinds of rule sets. Rules can be textual if..then..else rules, decision tables, decision trees, scoring models, neural networks or scripts. The ruleflow also has branching nodes to handle simple branches. Right now you can’t access the rule sets from the ruleflow diagram (a limitation of their current thin client approach) but this will change in a future release. The elements can be accessed from the tree structure. Rule flows can access outside web services – such as a credit bureau service – and simple mapping of data in the system to the web service is all that is required. A simple interface allows the use XPath to process the XML being returned so that only the results you need are mapped to your variables. The rule set editors next:
- Ruleset editor
This editor for textual rules is the basic rule editor. Has an If block, a Then block and an Else block. The full version of the rule is then generated/displayed as you edit the components. Conditions and actions are added using a point and click interface. Add a data element, add operators etc. No additional meta data (source, notes etc) at this time though this is in the roadmap as you would suspect. Only sequential execution is supported at this time. - Decision table
The final metaphor. This is actually a rule sheet rather than a classic decision table and is a fairly simple one. It allows variables and comparators to be defined for rows and actions. Each column is a rule. The interface is pretty basic and multiple rows would need to be defined to handle multiple comparators for an attribute. - Decision tree.
A basic graphical layout that seems nice for reasonably small trees. The editor has a zoom and a thumbnail tool to show the whole tree. When editing the tree you specify the output variable and then enter the editing mode. Each data element is displayed and can be clicked to add to the tree. Each time you add a data element it adds nodes for each allowed value (very nice integration of the data dictionary with the tree). Can right click and edit values directly in the tree. - Scorecard
This allows you to specify the values for each bin on each variable and so create a classic predictive scorecard. You can specify specific values or formulas for each value. There is no import of PMML yet (though this is under development) nor is there support for reason codes. The modeling work to determine the right bins and values would, as usual, need to be conducted in a data mining/predictive modeling tool. - Neural networks
Like scorecards these can be specified in the tool and both input and output data are identified. Again, you would need to have defined the network using something like PASW Modeler or KNIME.
Several of these rule sets can handle multi-valued variables and process across the group and all will shortly be able to do so. There is some support for validation on the policy and on rule sets where there is the potential for missing values.
R-Control, the last piece, supports unit testing both interactively and in batch. Logging of tests and execution is supported and the results can be graphed and analyzed. While re-testing against pre-defined expected results is not currently supported it is promised in a future release.
Delta-R is one of a small number of vendors offering the option to deploy a Decision as a Service and clients can choose to deploy scenarios to their own servers or through Delta-R’s SaaS offering.
The product has some way to go before it offers all the features of some of its competitors but it offers a nice range of capabilities, lots of metaphors for rules, support for integrating rules and models and an appealing thin-client approach. Future plans include audit trails, direct links to rule sets from the ruleflow and a more web 2.0 interface using AJAX.