We use cookies, including third-party cookies from Google to serve personalized ads through AdSense, to operate this site and understand how it is used. By continuing to browse, you accept this use. See our Privacy Policy and Terms of Use for details, including how to opt out of personalized advertising.
Accept
SmartData CollectiveSmartData Collective
  • Analytics
    AnalyticsShow More
    chatgpt image jul 21, 2026, 04 34 30 pm
    4 Core Benefits of Predictive Maintenance after Vibration Analysis
    10 Min Read
    How Does Data Mining Boost Customer Satisfaction in Logistics? Harnessing Analytics for Results -- AI-generated illustration
    How Does Data Mining Boost Customer Satisfaction in Logistics? Harnessing Analytics for Results
    11 Min Read
    chatgpt image jul 13, 2026, 04 23 45 pm
    How Data Analytics Helps Companies Improve User Engagement
    19 Min Read
    chatgpt image jul 13, 2026, 03 59 46 pm
    How Data Analytics Improves Multi-Location Search Strategies
    10 Min Read
    cybersecurity efforts
    How Behavioral Analytics and AI Are Redefining Cybersecurity for Boca Raton Businesses
    14 Min Read
  • Big Data
  • BI
  • Exclusive
  • IT
  • Marketing
  • Software
Search
© 2008-25 SmartData Collective. All Rights Reserved.
Reading: Harvard Gets Access to Twitter Data Stream to Predict Foodborne Illness Outbreaks
Share
Notification
Font ResizerAa
SmartData CollectiveSmartData Collective
Font ResizerAa
Search
  • About
  • Help
  • Privacy
Follow US
© 2008-23 SmartData Collective. All Rights Reserved.
SmartData Collective > Big Data > Data Mining > Harvard Gets Access to Twitter Data Stream to Predict Foodborne Illness Outbreaks
AnalyticsBig DataBusiness IntelligenceData MiningExclusiveModelingPredictive AnalyticsSocial DataText Analytics

Harvard Gets Access to Twitter Data Stream to Predict Foodborne Illness Outbreaks

Cameron Graham
Cameron Graham
4 Min Read
Harvard Gets Access to Twitter Data Stream to Predict Foodborne Illness Outbreaks
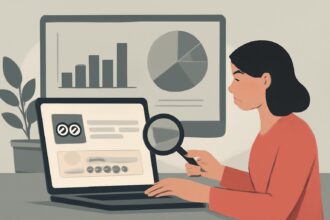
Illustration generated with Qwen Image.
SHARE

Harvard Medical School, in partnership with the Boston Children’s Hospital, r

Harvard Medical School, in partnership with the Boston Children’s Hospital, recently secured a research grant to help them find new ways to track outbreaks of foodborne illnesses. Unlikely most grants though, this one isn’t a monetary award, nor did it come from a government agency or research foundation. Instead, the reward is access to tweets, and was provided by Twitter as part of their inaugural Data Grants initiative.


The idea behind the pilot program is to give select research institutions access to the (highly lucrative) Twitter datastream in order to leverage social media for social good. Harvard will be able to tap into both Twitter’s public stream, and their archive of historical data, going back to the first tweet. Some of the other Data Grant recipients include the University of East London, and UCSD.

More Read

Private versus Public Clouds for ERP Software
Big Data: Aspirin for Travelers’ Headaches
Cloud-Centric Companies Discover Benefits & Pitfalls of Network Relocation
Open Source Analytics Reaches Main Street (and Some Other Trends in Analytics)
Visualizing Katrina’s Strongest Winds with R


Harvard and the Boston Children’s Hospital will attempt to correlate patterns in the Twitter data with records of foodborne illness, in order to predict and track future outbreaks. If this sounds familiar, it’s because Google created a similar tracking index for the flu in 2008. Google’s method relied on search data from millions of users worldwide to predict how the flu would spread. However, researchers have recently criticized Google’s methods, pointing out that the search giant overestimated the severity of flu outbreaks in 2011-12 by more than 50%.


The lead researcher for the Harvard project, John Brownstein, told the Harvard Crimson that Twitter offers an advantage over other internet collected data because the social platform allows for individual follow-ups. If researchers can verify a link between a user’s tweets and actual foodborne illnesses, by directly corresponding with the individual over Twitter, they can finetune their predictive model, and verify results.


In order to accomplish such a study, Harvard and the Boston Children’s Hospital will likely be using some of the same SaaS business intelligence tools that private companies utilize. As large scale data analysis begins to play a more important role in clinical studies and research, the market for both analytics software and large-scale data sets will increase.


Twitter limits access to their so-called “firehose” (a direct stream of real-time tweets) to select partners, who then resell pieces of it to other companies. While it’s unclear how much this access costs, Twitter generated over $53 million from such data licensing in the first half of 2013.

Looked at cynically, the #DataGrants program could be designed to show the validity and accuracy of their platform, which would allow Twitter to raise their asking price for data access. At the very least, it’s likely to produce positive publicity.

Whether or not Harvard’s initiative is a success won’t be known for some time. However, if it does prove effective, other social media networks such as Facebook, or rising platforms like WhatsApp, may come under pressure to allow research access to their own data sets. They may also embrace the opportunity to show off their targeting abilities. After all, as companies compete for advertising revenue, those with the most precise insight into customer behavior will be the ones left standing. What better way to show that than through an Ivy League endorsed research study?


Share This Article
Facebook Pinterest LinkedIn
Share

Follow us on Facebook

Latest News

Synthetic Data vs Real Web Data: Comparison, Limitations, and Collection Methods  -- AI-generated illustration
Synthetic Data vs Real Web Data: Comparison, Limitations, and Collection Methods 
Big Data Exclusive
Illustration of mobile analytics dashboards with ad performance charts connected to backend databases
11 Best Sisense Alternatives for Embedded Analytics
Business Intelligence Exclusive
Analyst points at colorful circular data dashboard on screen - information technology business metrics
How Fragmented Workplace Tech Undermines Reliable Business Metrics and Reporting
Cloud Computing Exclusive Infographic IT
Using Multi-Source Data and Analytics to Detect Operational Drift Across Franchise Networks -- AI-generated illustration
Using Multi-Source Data and Analytics to Detect Operational Drift Across Franchise Networks
Exclusive Infographic

Stay Connected

1.2KFollowersLike
33.7KFollowersFollow
222FollowersPin

You Might also Like

The Panama Papers- It’s all about the data!
Big DataData ManagementData MiningITSecurity

The Panama Papers- It’s all about the data!

8 Min Read
Using Data Science on TripAdvisor Reviews (Part 1)
AnalyticsBig DataData MiningSocial DataText Analytics

Using Data Science on TripAdvisor Reviews (Part 1)

6 Min Read
Gaming Industry
Big DataData ManagementFeatured

How Big Data Can Boost the Gaming Industry

9 Min Read
How to Gain a Competitive Advantage with Big Data
Analytics

How to Gain a Competitive Advantage with Big Data

6 Min Read

SmartData Collective is one of the largest & trusted community covering technical content about Big Data, BI, Cloud, Analytics, Artificial Intelligence, IoT & more.

How To Get An Award Winning Giveaway Bot
Big Data Chatbots Exclusive
5 Great Tips for Using Data Analytics for Website UX
Big Data

Quick Link

  • About
  • Contact
  • Privacy
Follow US
© 2008-26 SmartData Collective. All Rights Reserved.
Welcome Back!

Sign in to your account

Username or Email Address
Password

Lost your password?