We use cookies, including third-party cookies from Google to serve personalized ads through AdSense, to operate this site and understand how it is used. By continuing to browse, you accept this use. See our Privacy Policy and Terms of Use for details, including how to opt out of personalized advertising.
Accept
SmartData CollectiveSmartData Collective
  • Analytics
    AnalyticsShow More
    chatgpt image jul 21, 2026, 04 34 30 pm
    4 Core Benefits of Predictive Maintenance after Vibration Analysis
    10 Min Read
    How Does Data Mining Boost Customer Satisfaction in Logistics? Harnessing Analytics for Results -- AI-generated illustration
    How Does Data Mining Boost Customer Satisfaction in Logistics? Harnessing Analytics for Results
    11 Min Read
    chatgpt image jul 13, 2026, 04 23 45 pm
    How Data Analytics Helps Companies Improve User Engagement
    19 Min Read
    chatgpt image jul 13, 2026, 03 59 46 pm
    How Data Analytics Improves Multi-Location Search Strategies
    10 Min Read
    cybersecurity efforts
    How Behavioral Analytics and AI Are Redefining Cybersecurity for Boca Raton Businesses
    14 Min Read
  • Big Data
  • BI
  • Exclusive
  • IT
  • Marketing
  • Software
Search
© 2008-25 SmartData Collective. All Rights Reserved.
Reading: Conditional probability: an easier way
Share
Notification
Font ResizerAa
SmartData CollectiveSmartData Collective
Font ResizerAa
Search
  • About
  • Help
  • Privacy
Follow US
© 2008-23 SmartData Collective. All Rights Reserved.
SmartData Collective > Analytics > Predictive Analytics > Conditional probability: an easier way
Predictive Analytics

Conditional probability: an easier way

DavidMSmith
DavidMSmith
5 Min Read
Conditional probability: an easier way
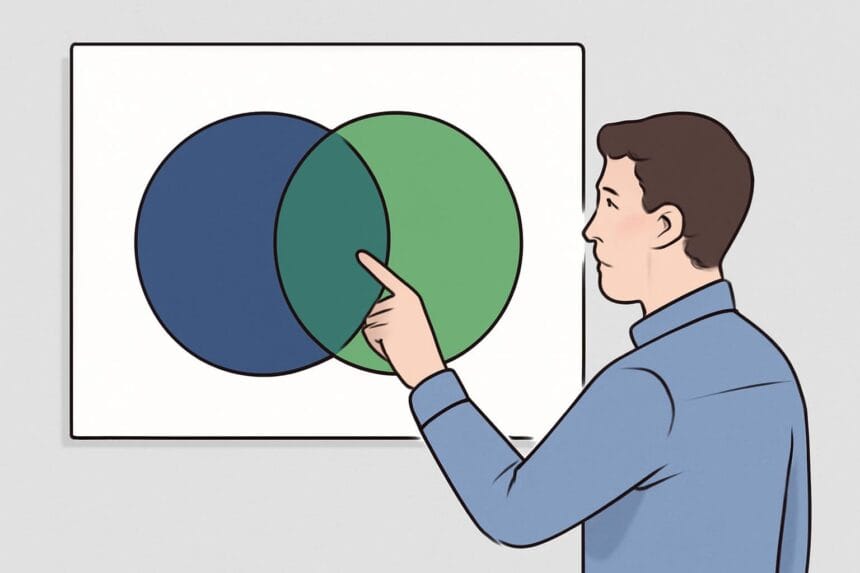
Illustrative image generated with OpenAI gpt-image-1.
SHARE

Conditional probabilities are bane of many students of Statistics, but statements of conditional probability come up surprisingly often in real life. For example, as Steven Strogatz writes in the New York Times, when doctors are asked to estimate the probability that a woman has breast cancer given a positive mammogram test result, most get the answer wildly wrong despite being given the population frequency of breast cancer and the conditional probability of false positives from a mammogram test. Here’s one doctor’s experience trying to come up with a number:

“[He] was visibly nervous while trying to figure out what he would tell the woman.  After mulling the numbers over, he finally estimated the woman’s probability of having breast cancer, given that she has a positive mammogram, to be 90 percent.  Nervously, he added, ‘Oh, what nonsense.  I can’t do this.  You should test my daughter; she is studying medicine.’  He knew that his estimate was wrong, but he did not know how to reason better.  Despite the fact that he had spent 10 minutes wringing his mind for an answer, he could not figure out how to draw a sound inference from the probabilities.” [The correct answer is 9 percent.]

Most students (and doctors!) are taught to use Bayes’ Theorem to calculate marginal probabilities from conditional probabilities, but as Strogatz point out this isn’t exactly an intuitive calculation, with the dividing of probabilities by probabilities and all. He suggests a more intuitive (but slightly less accurate) method is to think instead about frequencies within concrete groups and sub-groups. For the mammogram test, the calculation becomes:

Eight out of every 1,000 women have breast cancer.  Of these 8 women with breast cancer, 7 will have a positive mammogram.  Of the remaining 992 women who don’t have breast cancer, some 70 will still have a positive mammogram.  Imagine a sample of women who have positive mammograms in screening. How many of these women actually have breast cancer?

Since a total of 7 + 70 = 77 women have positive mammograms, and only 7 of them truly have breast cancer, the probability of having breast cancer given a positive mammogram is 7 out of 77, which is 1 in 11, or about 9 percent.

This method is frowned upon by textbooks, because it’s not as accurate (in the example above, rounding to whole numbers of women in the groups), and because it implicitly assumes that the frequency of the event (here, breast cancer) is determined solely by the probability, with no accounting for variation. But it is an intuitive method for understanding conditional probability, that seems more likely (ha!) to come up with an reasonably accurate answer for many people.

Read the rest of Strogatz’s article for other examples of intuitive conditional probability calculations, including a great example from the OJ Simpson trial.

More Read

Building an Analytical Portal to Support Analytical Culture
It’s time to industrialize analytics
Intro to Pervasive Business Intelligence (via…
Redefining Loyalty Programs with Big Data and Hadoop
Facebook’s Big Data: Equal Parts Exciting and Terrifying?

New York Times Opinionator: Chances Are

Link to original post

TAGGED:statistics
Share This Article
Facebook Pinterest LinkedIn
Share

Follow us on Facebook

Latest News

Best VMware Alternatives in Thailand for Private Cloud and HCI Deployments -- AI-generated illustration
Best VMware Alternatives in Thailand for Private Cloud and HCI Deployments
Cloud Computing Exclusive IT
Using Safety Metrics and Incident Data to Reduce Construction Risk and Insurance Costs -- AI-generated illustration
Using Safety Metrics and Incident Data to Reduce Construction Risk and Insurance Costs
Big Data Exclusive
How Business Intelligence Can Help Small Businesses Build Better Decision Rules -- AI-generated illustration
How Business Intelligence Can Help Small Businesses Build Better Decision Rules
Business Intelligence Business Rules Exclusive
Stellar Repair for MS SQL Review: Can It Repair SQL Databases? -- AI-generated illustration
Stellar Repair for MS SQL Review: Can It Repair SQL Databases?
Exclusive Software SQL

Stay Connected

1.2KFollowersLike
33.7KFollowersFollow
222FollowersPin

You Might also Like

Learning SPSS for SAS users
Data MiningPredictive Analytics

Learning SPSS for SAS users

4 Min Read

4 Retail BI Lessons to Learn from Google’s Nexus Fail

5 Min Read
The Human Factor Continually Confounds Probability Models
ExclusiveModelingPredictive AnalyticsStatistics

The Human Factor Continually Confounds Probability Models

3 Min Read
Business People Are Dumb On Average(s)
AnalyticsCulture/LeadershipData MiningData QualityDecision Management

Business People Are Dumb On Average(s)

7 Min Read

SmartData Collective is one of the largest & trusted community covering technical content about Big Data, BI, Cloud, Analytics, Artificial Intelligence, IoT & more.

How To Get An Award Winning Giveaway Bot
Big Data Chatbots Exclusive
5 Great Tips for Using Data Analytics for Website UX
Big Data

Quick Link

  • About
  • Contact
  • Privacy
Follow US
© 2008-26 SmartData Collective. All Rights Reserved.
Welcome Back!

Sign in to your account

Username or Email Address
Password

Lost your password?