We use cookies, including third-party cookies from Google to serve personalized ads through AdSense, to operate this site and understand how it is used. By continuing to browse, you accept this use. See our Privacy Policy and Terms of Use for details, including how to opt out of personalized advertising.
Accept
SmartData CollectiveSmartData Collective
  • Analytics
    AnalyticsShow More
    chatgpt image jul 21, 2026, 04 34 30 pm
    4 Core Benefits of Predictive Maintenance after Vibration Analysis
    10 Min Read
    How Does Data Mining Boost Customer Satisfaction in Logistics? Harnessing Analytics for Results -- AI-generated illustration
    How Does Data Mining Boost Customer Satisfaction in Logistics? Harnessing Analytics for Results
    11 Min Read
    chatgpt image jul 13, 2026, 04 23 45 pm
    How Data Analytics Helps Companies Improve User Engagement
    19 Min Read
    chatgpt image jul 13, 2026, 03 59 46 pm
    How Data Analytics Improves Multi-Location Search Strategies
    10 Min Read
    cybersecurity efforts
    How Behavioral Analytics and AI Are Redefining Cybersecurity for Boca Raton Businesses
    14 Min Read
  • Big Data
  • BI
  • Exclusive
  • IT
  • Marketing
  • Software
Search
© 2008-25 SmartData Collective. All Rights Reserved.
Reading: According to Microsoft, the fourth paradigm of science is data
Share
Notification
Font ResizerAa
SmartData CollectiveSmartData Collective
Font ResizerAa
Search
  • About
  • Help
  • Privacy
Follow US
© 2008-23 SmartData Collective. All Rights Reserved.
SmartData Collective > Big Data > Data Mining > According to Microsoft, the fourth paradigm of science is data
Data Mining

According to Microsoft, the fourth paradigm of science is data

DavidMSmith
DavidMSmith
3 Min Read
According to Microsoft, the fourth paradigm of science is data
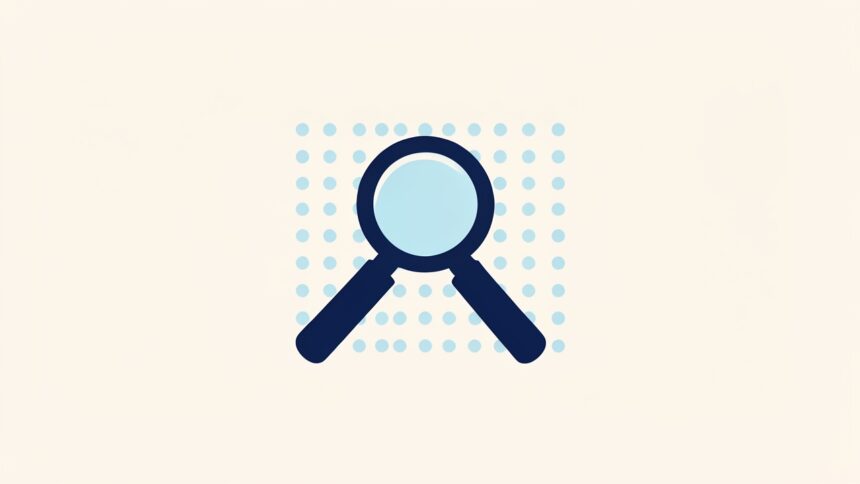
Illustration generated with FLUX.2 [klein 4B] via Cloudflare Workers AI.
SHARE

In scientific discovery, the first three paradigms were experimental, theoretical and (more recently) computational science. A new book of essays published by Microsoft (and available for free download — kudos, MS!) argues that a fourth paradigm of scientific discovery is at hand: the analysis of massive data sets. The book is dedicated to the late Microsoft researcher Dr Jim Gray, who pioneered the idea with the catchphrase: “It’s the data, stupid”. The basic idea is that our capacity for collecting scientific data has far outstripped our present capacity to analyze it, and so our focus should be on developing technologies that will make sense of this “Deluge of Data” (as this New York Times review of the book — well worth a read — calls it). 

Dr Gray’s call-to-arms was not to develop isolated super-powerful super-computers but “to have a world in which all of the science literature is online, all of the science data is online, and they interoperate with each other.” This dream is already close to a reality in some scientific domains like astronomy, where advanced instruments routinely generate petabytes of data available for public analysis. And with further developments in distributed and high-performance computing, with freely-available high-scale data management tools like Hadoop, and with advanced open-source data-analysis tools like R rapidly adapting to the scales of these data sets, the fourth paradigm is certain to become a mainstream reality in other scientific domains as well. 

Microsoft Research: The Fourth Paradigm: Data-Intensive Scientific Discovery

More Read

How FlightCaster Squeezes Predictions from Flight Data
Interview – David Smith REvolution Computing
The Fallacy of the Data Scientist Shortage
What’s the Big Deal About Big Data?
Analytics Overkill: Dashboards, Analysis and Big Data in the US Election

Link to original post

Share This Article
Facebook Pinterest LinkedIn
Share

Follow us on Facebook

Latest News

Illustration of mobile analytics dashboards with ad performance charts connected to backend databases
11 Best Sisense Alternatives for Embedded Analytics
Business Intelligence Exclusive
Analyst points at colorful circular data dashboard on screen - information technology business metrics
How Fragmented Workplace Tech Undermines Reliable Business Metrics and Reporting
Cloud Computing Exclusive Infographic IT
Using Multi-Source Data and Analytics to Detect Operational Drift Across Franchise Networks -- AI-generated illustration
Using Multi-Source Data and Analytics to Detect Operational Drift Across Franchise Networks
Exclusive Infographic
Beyond The First Impression: The Long-Lasting Impact Of Sensory Marketing -- AI-generated illustration
Beyond The First Impression: The Long-Lasting Impact Of Sensory Marketing
Infographic Marketing

Stay Connected

1.2KFollowersLike
33.7KFollowersFollow
222FollowersPin

You Might also Like

Mining for consumer behavior in Tweets
Data Mining

Mining for consumer behavior in Tweets

5 Min Read
Weathering the Stormy Economy
Data Mining

Weathering the Stormy Economy

4 Min Read
Musings on Watson: Why Healthcare?
AnalyticsBusiness IntelligenceBusiness RulesCommentaryData MiningDecision ManagementKnowledge ManagementModelingNew ProductsNewsPredictive AnalyticsStatisticsText AnalyticsUnstructured Data

Musings on Watson: Why Healthcare?

12 Min Read
Demystifying Self-Service Data and the Future of Business Intelligence
Big DataData Mining

Demystifying Self-Service Data and the Future of Business Intelligence

6 Min Read

SmartData Collective is one of the largest & trusted community covering technical content about Big Data, BI, Cloud, Analytics, Artificial Intelligence, IoT & more.

ai chatbot
How AI Website Chatbots Improve Customer Support and Lead Generation
Chatbots Exclusive
From Bolts to Bots: How AI Is Fortifying the Automotive Industry
Artificial Intelligence

Quick Link

  • About
  • Contact
  • Privacy
Follow US
© 2008-26 SmartData Collective. All Rights Reserved.
Welcome Back!

Sign in to your account

Username or Email Address
Password

Lost your password?