We use cookies, including third-party cookies from Google to serve personalized ads through AdSense, to operate this site and understand how it is used. By continuing to browse, you accept this use. See our Privacy Policy and Terms of Use for details, including how to opt out of personalized advertising.
Accept
SmartData CollectiveSmartData Collective
  • Analytics
    AnalyticsShow More
    Flat editorial illustration: The article is about joining public web signals with internal business metrics so BI teams can inter
    Alternative Data in BI: Bringing Public Web Data Into Your Dashboards
    23 Min Read
    Flat editorial illustration: The article is about automating the collection, preparation, and delivery of marketing data across p
    From Data to Dashboards: 5 Marketing Reporting Automation Software Picks
    12 Min Read
    Flat editorial illustration: The article contrasts passive follower totals with a behavioral path from attention and trust to cli
    Creator Analytics Beyond Follower Count: Seven Metrics That Measure Audience Behavior
    11 Min Read
    Flat editorial illustration: The article connects AI and marketing analytics with managerial judgment grounded in consumer behavi
    How an Online MBA in Marketing Connects AI and Data Analytics
    11 Min Read
    What Kind of Problem-Solving Distinguishes Data Analysts From Software Engineers -- AI-generated illustration
    What Kind of Problem-Solving Distinguishes Data Analysts From Software Engineers
    7 Min Read
  • Big Data
  • BI
  • Exclusive
  • IT
  • Marketing
  • Software
Search
© 2008-25 SmartData Collective. All Rights Reserved.
Reading: I Love Data
Share
Notification
Font ResizerAa
SmartData CollectiveSmartData Collective
Font ResizerAa
Search
  • About
  • Help
  • Privacy
Follow US
© 2008-23 SmartData Collective. All Rights Reserved.
SmartData Collective > Uncategorized > I Love Data
Uncategorized

I Love Data

Editor SDC
Editor SDC
2 Min Read
I Love Data
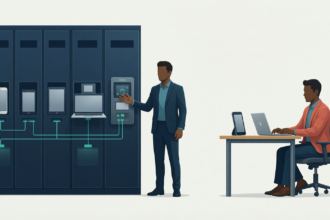
Illustration generated with FLUX.2 [klein 4B] via Cloudflare Workers AI.
SHARE

Data is more than bits and bytes in a database: it can tell you a lot about the health of your business and business processes.

No, I’m not confessing to having a “thing” for the android in Star trek: The Next Generation – I’m talking about the data that fuels businesses in the information age.  Some people would have you believe that data is boring, just a collection of bits and bytes in a database, but it is far more than that to me.  Data is Money.  Data is Knowledge.  Data is People.

Profiling and analysing a companies data can tell you so much about the health of the business and its business processes.  These techniques allow you to identify and diagnose business maladies just as a doctor uses blood tests and scans to investigate human ailments.  Data quality tools like dn:Director not only provide you with the ability to carry out an initial examination and diagnosis, but to continually assess the health of data: it’s like hooking your business up to a heart monitor.

More Read

Collablogaunity
Collablogaunity
Twitter, What We Have Done; What is Possible?
Stop Saying PR is Public Relations
How Do I Become a Data Scientist?
A 5-Step Approach to Managing Your Manufacturing Marketing Data

Of course human doctors don’t just treat symptoms of an illness, they tackle the disease itself and the same is true for the data doctor.  Identifying and treating the root causes of data issues is essential if you don’t want to get lost in a cycle of data cleansing, scrap and rework.  This means attending to the business processes, procedures and controls as well as operating on the data.

Share This Article
Facebook Pinterest LinkedIn
Share

Follow us on Facebook

Latest News

Flat editorial illustration: The article is about joining public web signals with internal business metrics so BI teams can inter
Alternative Data in BI: Bringing Public Web Data Into Your Dashboards
Big Data Business Intelligence Exclusive Web Analytics
Flat editorial illustration: A SaaS-editorial scene showing product usage, support patterns, and renewal feedback informing a fle
Using Product Usage Analytics and Support Data to Build a B2B Product Roadmap
Business Intelligence Infographic
From Hiring To Payroll: Managing HR Data Across Business Systems -- AI-generated illustration
From Hiring To Payroll: Managing HR Data Across Business Systems
Big Data Business Intelligence Infographic
Flat editorial illustration: The article is about automating the collection, preparation, and delivery of marketing data across p
From Data to Dashboards: 5 Marketing Reporting Automation Software Picks
Analytics Business Intelligence Exclusive Marketing

Stay Connected

1.2KFollowersLike
33.7KFollowersFollow
222FollowersPin

You Might also Like

Differences Between Large and Small Companies Using BYOD
Uncategorized

Differences Between Large and Small Companies Using BYOD

5 Min Read
Those Who Give Twitter *Get* Twitter
Uncategorized

Those Who Give Twitter *Get* Twitter

5 Min Read
6 Ways to Futureproof Your Linux Infrastructure [SLIDESHARE]
Uncategorized

6 Ways to Futureproof Your Linux Infrastructure [SLIDESHARE]

3 Min Read
5 Sherlock Holmes Quotes That Prove Genius for Data-Driven Decision Making
Uncategorized

5 Sherlock Holmes Quotes That Prove Genius for Data-Driven Decision Making

6 Min Read

SmartData Collective is one of the largest & trusted community covering technical content about Big Data, BI, Cloud, Analytics, Artificial Intelligence, IoT & more.

How To Get An Award Winning Giveaway Bot
Big Data Chatbots Exclusive
5 Great Tips for Using Data Analytics for Website UX
Big Data

Quick Link

  • About
  • Contact
  • Privacy
Follow US
© 2008-26 SmartData Collective. All Rights Reserved.
Welcome Back!

Sign in to your account

Username or Email Address
Password

Lost your password?