We use cookies, including third-party cookies from Google to serve personalized ads through AdSense, to operate this site and understand how it is used. By continuing to browse, you accept this use. See our Privacy Policy and Terms of Use for details, including how to opt out of personalized advertising.
Accept
SmartData CollectiveSmartData Collective
  • Analytics
    AnalyticsShow More
    What Kind of Problem-Solving Distinguishes Data Analysts From Software Engineers -- AI-generated illustration
    What Kind of Problem-Solving Distinguishes Data Analysts From Software Engineers
    7 Min Read
    chatgpt image jul 21, 2026, 04 34 30 pm
    4 Core Benefits of Predictive Maintenance after Vibration Analysis
    10 Min Read
    How Does Data Mining Boost Customer Satisfaction in Logistics? Harnessing Analytics for Results -- AI-generated illustration
    How Does Data Mining Boost Customer Satisfaction in Logistics? Harnessing Analytics for Results
    11 Min Read
    chatgpt image jul 13, 2026, 04 23 45 pm
    How Data Analytics Helps Companies Improve User Engagement
    19 Min Read
    chatgpt image jul 13, 2026, 03 59 46 pm
    How Data Analytics Improves Multi-Location Search Strategies
    10 Min Read
  • Big Data
  • BI
  • Exclusive
  • IT
  • Marketing
  • Software
Search
© 2008-25 SmartData Collective. All Rights Reserved.
Reading: Value at Risk Segmentation and Retention Campaigns
Share
Notification
Font ResizerAa
SmartData CollectiveSmartData Collective
Font ResizerAa
Search
  • About
  • Help
  • Privacy
Follow US
© 2008-23 SmartData Collective. All Rights Reserved.
SmartData Collective > Big Data > Data Mining > Value at Risk Segmentation and Retention Campaigns
Data MiningMarket Research

Value at Risk Segmentation and Retention Campaigns

Editor SDC
Editor SDC
2 Min Read
Value at Risk Segmentation and Retention Campaigns
Photo by Kindel Media on Pexels (https://www.pexels.com/photo/people-discuss-strategy-documents-7688106/)
SHARE

In Propensity Based Segmentation customers are grouped according to propensity scores, such as churn scores, cross selling scores etc., as estimated by respective classification (propensity) models. Propensity scores can also be combined with other segmentation schemes to better target marketing actions. The Value at Risk segmentation scheme is developed by combining propensities with Value Segments to prioritize retention actions. 


Churn models estimate the churn propensity for each customer, indicating the likelihood of churn. Through simple computations and binning, customers can then be assigned to distinct groups based on their churn score. For instance, appropriate cut-off values can be selected and customers can be divided into groups of low, medium and high churn likelihood as a result of a churn model. 


When value segments are cross-examined with churn propensity segments we have the Value at Risk segmentation, a compound segmentation which can be used for prioritizing retention campaigns. An example of this segmentation is shown in the following figure. 


Six compound segments are created after combining the Low-Medium-High value segments with the Low-Medium-High risk segments (the segments of Low and Medium value segments are collapsed to final segments 5 and 6).


Clearly, segment 1 the most critical one as it contains high value customers with increased risk of terminating their relation with the organization. For this segment, retention is a high priority.


TAGGED:churn modelcrmdata mining
Share This Article
Facebook Pinterest LinkedIn
Share

Follow us on Facebook

Latest News

Flat editorial illustration: The article’s core relationship is between growing compute density and adaptable rack hardware that
6 Details That Make a Data Centre’s Server Room Easier to Scale
Best Practices Data Management Exclusive IT
Flat editorial illustration: The article’s core relationship is a transfer of discipline from regulated laboratories to analytics
What Business Intelligence Teams Can Learn from Lab Data Governance
Business Intelligence Exclusive
Flat editorial illustration: A guaranteed reward can raise participation while skewing the respondent pool toward active customer
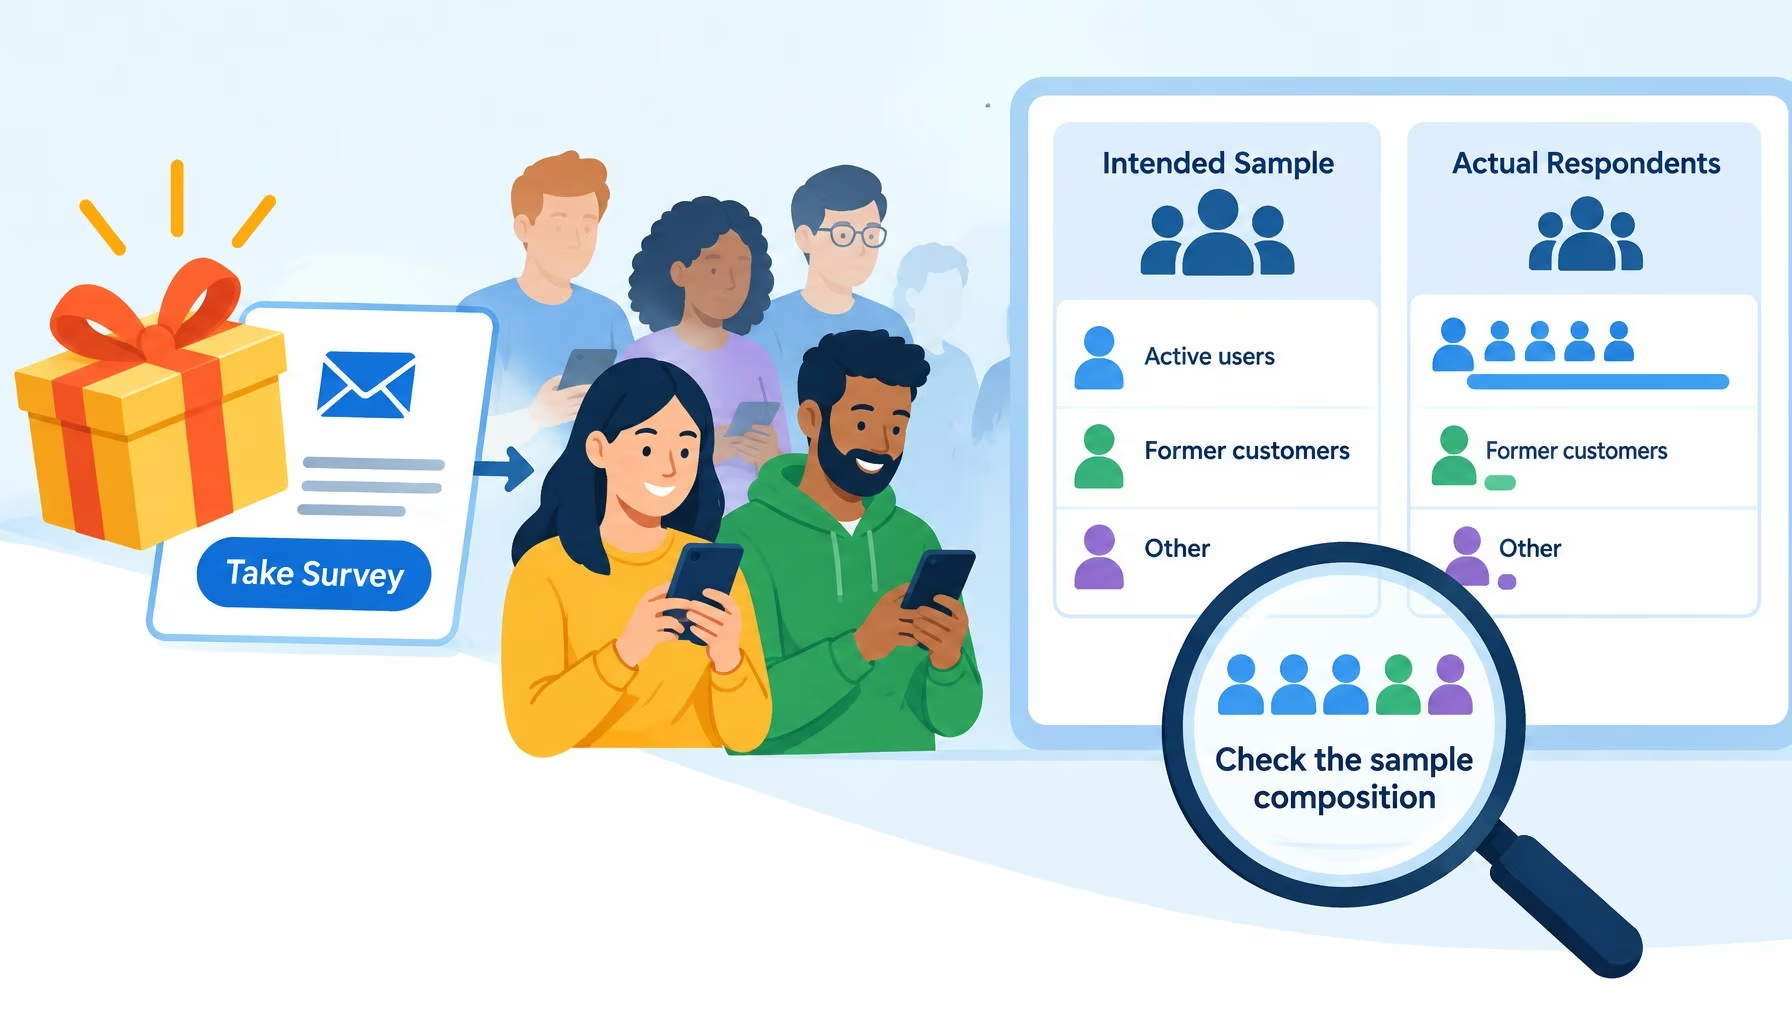
Incentive-Driven Response Bias: Auditing Sample Composition Before You Trust Survey Data
Big Data Data Quality Exclusive
Flat editorial illustration: The article’s core relationship is observable blockchain activity becoming a trustworthy business me
Blockchain Dashboards Need Better Definitions, Not More Charts
Blockchain Exclusive

Stay Connected

1.2KFollowersLike
33.7KFollowersFollow
222FollowersPin

You Might also Like

Counting Observations
Data MiningData Visualization

Counting Observations

6 Min Read
business intelligence use in enterprises
Artificial IntelligenceBusiness IntelligenceCRMDecision ManagementKnowledge Management

Embracing Business Intelligence for a Better Tomorrow

5 Min Read
Social Collaboration Is in Finance's Future
AnalyticsBig DataCloud Computing

Social Collaboration Is in Finance’s Future

9 Min Read
Integrating Quality Assurance into Your CRM Operations
Uncategorized

Integrating Quality Assurance into Your CRM Operations

5 Min Read

SmartData Collective is one of the largest & trusted community covering technical content about Big Data, BI, Cloud, Analytics, Artificial Intelligence, IoT & more.

Chatbots and SEO: How Can Chatbots Improve Your SEO Ranking?
Artificial Intelligence Chatbots Exclusive
Artificial Intelligence for eCommerce: A Closer Look
Artificial Intelligence

Quick Link

  • About
  • Contact
  • Privacy
Follow US
© 2008-26 SmartData Collective. All Rights Reserved.
Welcome Back!

Sign in to your account

Username or Email Address
Password

Lost your password?