

Amid the rise of cutting-edge digital marketing and SEO tools like SEO analyzer and backlink checker, we often forget about Google Analytics. However, this is the case only with those who don?t know the real potential of Google Analytics.
In reality, Google Analytics is an incredible tool that can provide you with in-depth understanding of how various aspects of your website are performing, along with information about how different types of visitors behave when they visit your website.
With the right applications, this information can transform the results you can drive from your marketing funnels and website.
However, without knowing how to obtain this information or what to do with it, you may find yourself mindlessly browsing arbitrary metrics on Google Analytics such as user data, session data, or session durations. This is one of the most important ways to track the effectiveness of an SEO strategy.
Sure, these metrics can be revealing when it comes to the performance of your website, but the reality is that these metrics don?t even scratch the surface of the incredible things you can do with Google Analytics.
The ?ready to consume? information available on Google analytics may provide you with insights but it doesn?t provide you with any sort of actionable information that you can utilize to boost your website?s performance and conversions.
Let?s look at a few ways you can look beyond the obvious and readily available information in Google Analytics. These are the tricks that SEO agencies utilize to drive results for their clients and I am positive that you can do the same:
Assign Monetary Value to Goals
Regardless of what platform or marketing strategy you are using, setting up goals is usually the very first step. It allows you to accurately measure your rate of success or failure and make optimizations accordingly.
In Google Analytics, you can define specific actions taken by a user on your website as Goals. For product websites, this Goal can be completing a purchase. For service or lead generation websites, this Goal can be the act of filling out a contact form by a visitor.
While setting up Goals on Google Analytics is a fairly popular practice, few marketers and website owners go through the trouble of associating a dollar value to their goals.
Suppose a visitor lands on your website. There are certain steps that they have to subsequently take in order to complete a goal and register a ?conversion?. These steps are part of your ?Goal Flow?. Even the pages that are involved in this process of completing a conversion are part of your Goal Flow.
Assigning a dollar value to your conversion goal allows you to calculate the exact monetary value of losing a prospect at each step of your Goal Flow.
So, when you set up a Goal on Google Analytics, and assign a dollar value to your goal, the Analytics algorithm automatically assigns dollar values to the various pages involved in the process of achieving that goal.
This value is usually calculated on the basis of the significance of that page in the Goal Flow and can be viewed under the ?Page Value? section of your Google Analytics traffic scorecard.
If you already have a Goal set up on your website, you can assign a dollar value to the same by navigating to the Admin section of Google Analytics. From there, click on the ?Goals? tab and you will be presented with a list of all the goals you have set up so far.
Next, when you click on a specific goal, you will be presented with the option of assigning a monetary value to the goal.
Simply add the value and you are good to go!
If this is the first time you are doing this, it is advisable to be conservative with the dollar value to assign to the completion of each goal, since at this point, it will be an estimate. Later, when you have enough data, you can assign a more accurate dollar value to your goals.
Now, with this information, combined with the traffic information about how your audience behaves on your website, you can see the exact amount of money you may be losing when a visitor abandons the Goal Flow at a particular step.
Unlike the readily available information in Google Analytics, you can use this information to optimize your Goal Flow by identifying bottlenecks and redundant steps that may be hurting your conversions and eliminating them.
Get Reports and Updates Delivered to Your Mail Inbox
Google Analytics, as a platform to extract data, gives users access to some truly deep insights. However, extracting such reports can be a cumbersome and time-consuming task.
Another downside of Google Analytics reporting is one that is a bit less commonly experienced by Google Analytics users. This one has to do with the sudden and unexplained changes in your website activity.
Such unusual changes in activity, like a sudden surge in traffic numbers, can be difficult to track, especially when you find out about them only when you check reports in Google Analytics. Even then, there is a good chance that a short event may not stand out in your reports.
Thankfully, both these problems/challenges can be solved by creating custom alerts in Google Analytics.
To set up a custom alert, begin by visiting the ?Intelligence Events? section in your Google Analytics reporting section. Next, from the menu on the right, select ?Custom Alerts? and then select the ?Manage Custom Alerts? option.
Once you do that, you will be presented with a variety of parameters you can use to define when Google Analytics should alter you.
Here, you can specify the conditions in which the alert will be triggered. You may also notice a check-box next to the option that says ?Send me an email when this alert triggers?. By checking the box, you can ensure you are alerted by such updates and events directly in your inbox.
You can also add other email addresses (of your team members and stakeholders) that you want notified about specific events.
Create Custom Customer Segments
Customer or visitor insights are great for knowing who visits your website and how they interact with it. If you don?t know how to view visitor insights, follow these steps:
Select ?Audience? from the menu on the left > click on ?Interests? > click on ?Overview?.
This will present you with an overview of your audience, categorized into three categories. The Affinity Categories segment the audience by their interests. The In-Market Segment segments the audience by the industry they are involved with (finance/marketing/FMCG/ real estate etc.). Finally, the Other Category segments your traffic on all the other metrics that aren?t covered in the other two categories.
Now, if you think that this data is insightful, you will be pleased to know you can create your own custom segments that you can utilize against the custom goals that we created earlier (in the first section of this article).
To do this, go back to the ?Audiences? section of Google Analytics. Spot the drop-down menu just besides the ?All Sessions? header on the page. When you click on this drop-down menu, you will be presented with the page that you can utilize to create a custom audience section.
On this page, you will be able to select the demographics and the attributes mentioned in the default audience categories.
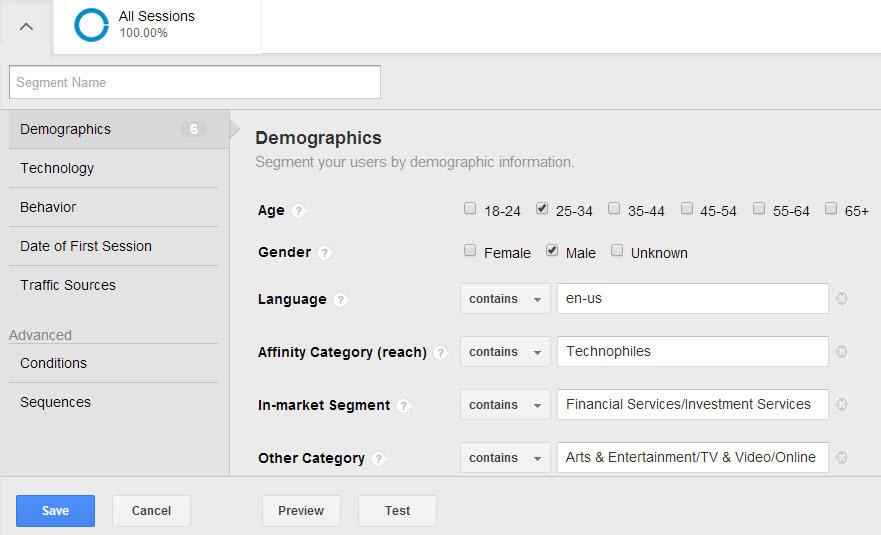
At the top, you can name this segment and save it. Once you have done that, Google Analytics will start tracking this audience against the other default audiences and you will be able to see exactly how these users interact with your website in comparison to all other users.
Notice the ?Date of First Session? tab on the menu on the left? By defining this, you can further refine your custom audience segments by date ranges and use the data to measure the success of specific campaigns.
Add Annotations
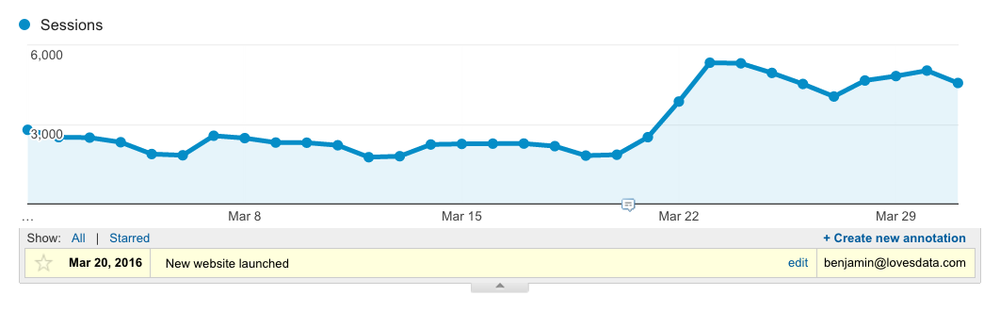
The screenshot above is the standard view of the sessions report of your website. Annotations are the small speech bubble icons that appear on the bottom line (Y-axis) of the graph.
These annotations can be used to better understand what actions led to changes in the graph above. For instance, in the screenshot above, the only annotation is about the launch of a new website. Post that, it is clearly visible that there is an improvement in the amount of traffic. So, this improvement can be attributed to the new website.
Similarly, you can add annotations about the actions you take on your website. To do this, click the downward arrow immediately below the graph. Here, you will notice the option to ?Create new annotation?, just like the screenshot above.
By clicking on that, you will be able to create a new annotation. You can also decide whether the annotation you set is ?public? or ?private? allowing you to control who sees a particular annotation.
Acting like notes within the Google Analytics interface, these annotations can make it easier for you to make sense of the traffic fluctuations on your website. When shared with your team, these annotations can help in ensuring everyone involved in a certain project or campaign is on the same page about whatever is happening on your website.
Conclusion
Google Analytics is an underrated tool that when used right, can provide powerful and actionable insights to website owners. With that said, there are still several Google Analytics features that I am yet to discover.
What are your favorite GA features that aren?t mentioned in this article? Share them with us in the comment section below!


