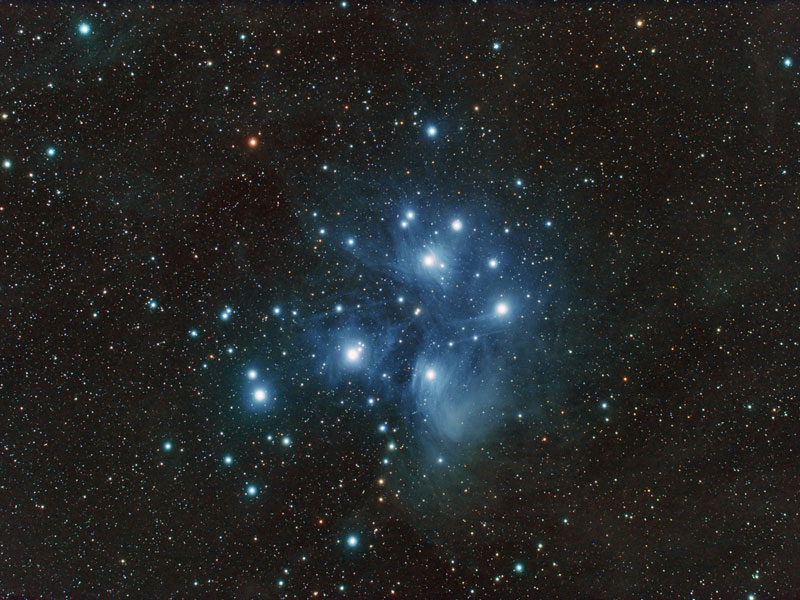
If you look at the picture below (Pleiades constellation), you will see – with the naked eye – that many star systems appear to be binary: that is, involving two (or more) stars orbiting around each other.
If you look at the picture below (Pleiades constellation), you will see – with the naked eye – that many star systems appear to be binary: that is, involving two (or more) stars orbiting around each other.
Is this a coincidence, or can we prove that from a statistical point of view, based on the theory of stochastic point processes, we are NOT dealing with a pure random process (Poisson process)? At first glance, as a statistician, I would say that the chance of observing so many pairs is extremely low, far below 0.000000001%. Now keep in mind that 2 stars that look very close to each other when viewed from Earth might actually be much more distant from each other than 2 stars that seem far apart, because we lack depth (the third dimension, or perspective) in these pictures. Also, most binary systems apparently consist of a normal star and a much smaller companion, thus we might see only a small fraction of all binary systems. In other words, maybe 90% of all solar systems are binary. Finally, there are cloudy areas in the picture below, where gas clouds hide stars located behind them.
The way to compute the probability to observe so many binary systems is as follows:

- Simulate one million realizations of a Poisson process on a rectangle (the size of the picture below), each with 300 points (I’m assuming there are about 300 relatively bright stars in the picture below; let’s ignore the dim stars as they are just adding noise).
- Compute the number of stars where closest neighbor is less than 1.5 millimeter away, for each of the one million simulations. Average your computations.
- If that average number is below x=5 as I would guess (or even if it is below x=20 for that matter), then clearly the Poisson assumption is violated since we observe at least x=50 bright binary stars in the picture, so we really are dealing with a star generation mechanism that favors binary over single stars.
Note that if you know elementary statistics and basic concepts about Poisson processes (the most basic of all stochastic processes), then you don’t even need to perform one million simulations. There is an exact mathematical formula that tells you the expected number of binary starts that you should see if binary stars were not favored: it is based on the Erlang distribution. Distances to nearest neighbors have extensively been studied in statistics; there is a solid theoretical background around it.
On a different topic, can we apply statistical principles used in astronomy, in the business world of big data?
I’m thinking of a measuring distance to far away stars as an example, where multiple measurements from a highly calibrated system are aggregated to refine the accuracy. In some ways, using multiple measurements to amplify a very weak signal. Can this concept of signal amplification be used to gain better, more accurate insights from big data? After all, business data is also very noisy and foggy: it also has its own clouds just as in the above picture, both metaphorically and physically, making statistical inference, pattern detection, and insights discoveries more difficult.