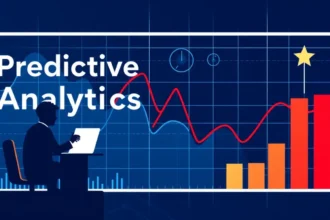
Whoever said “You can’t manage what you don’t measure” should be getting royalties from some interesting start-ups that are bringing the power of real-time analytics and data visualization to new audiences. One specialty provider, Localytics, is a Boston-based start-up that launched a set of tools for analyzing usage patterns and user behavior on mobile devices – getting deep insights on how users of Blackberry, Android, iPad/iPhone and other systems are interacting with voice, data, applications and their own data.
More Read

Localytics found that mobile app usage in the US and Canada peaked at 9:00 pm EST during the week and maintained peak usage throughout weekend afternoons and nights. In April, they reported that BlackBerry mobile apps were more concentrated and higher during the workday than iPhone.
And BlackBerry app users perform the same on the weekend — statistically identical to workweek usage. In contrast, iPhone owners use mobile apps more frequently on the weekend, “a rate 40% higher than the same time Monday through Friday,” according to its research. Find out more at their blog by clicking here and see how your usage compares with other mobile users.
Real-time selling sites such as Woot, Steep and Cheap, Groupon, Rue La La and others are watching the time of day, pricing, referral rates and other messages to track how “viral” their offers are when a particular item goes on sale. Analytics are making those sites transparent as they offer real-time inventory counts, build charts of how many visitors or buyers are trending and even dynamic pricing that adjusts as the buyers respond. Sites like Tippr or airlines and hotels are using time as a way to give early buyers a lower price for their commitment, and letting prices rise for late-comers.
In our rookie season, this blog has delved into sports statistics and even stadium load management or other fan-based analytics. We’ve covered weather analytics, traffic and other massive datasets that yield surprising details under the scrutiny of analytics. Heck, we even tried to forecast the World Cup (and lost out to that wise-guy octopus) or unearth the secret behind the analytics of a perfect Christmas present.
What would you like to see put under the microscope?
Are there useful or obscure facts and/or figures that we could dig in to for your reading or analytical enjoyment?
David Wallace
Spotfire Blogging Team
Image Credit: Courtesy of Flickr (Rob Smith Photographer)
")