Cookies help us display personalized product recommendations and ensure you have great shopping experience.

By using this site, you agree to the Privacy Policy and Terms of Use.
Accept
SmartData CollectiveSmartData Collective
  • Analytics
    AnalyticsShow More
    data analytics and truck accident claims
    How Data Analytics Reduces Truck Accidents and Speeds Up Claims
    7 Min Read
    predictive analytics for interior designers
    Interior Designers Boost Profits with Predictive Analytics
    8 Min Read
    image fx (67)
    Improving LinkedIn Ad Strategies with Data Analytics
    9 Min Read
    big data and remote work
    Data Helps Speech-Language Pathologists Deliver Better Results
    6 Min Read
    data driven insights
    How Data-Driven Insights Are Addressing Gaps in Patient Communication and Equity
    8 Min Read
  • Big Data
  • BI
  • Exclusive
  • IT
  • Marketing
  • Software
Search
© 2008-25 SmartData Collective. All Rights Reserved.
Reading: Map and Reduce in MapReduce: a SAS Illustration
Share
Notification
Font ResizerAa
SmartData CollectiveSmartData Collective
Font ResizerAa
Search
  • About
  • Help
  • Privacy
Follow US
© 2008-23 SmartData Collective. All Rights Reserved.
SmartData Collective > Software > Hadoop > Map and Reduce in MapReduce: a SAS Illustration
Hadoop

Map and Reduce in MapReduce: a SAS Illustration

JiangtangHu
JiangtangHu
3 Min Read
SHARE

In last post, I mentioned Hadoop, the open source implementation of Google’s MapReduce for parallelized processing of big data.

In last post, I mentioned Hadoop, the open source implementation of Google’s MapReduce for parallelized processing of big data. In this long National Holiday, I read the original Google paper, MapReduce: Simplified Data Processing on Large Clusters by Jeffrey Dean and Sanjay Ghemawat and got that the terminologies of “map” and “reduce” were basically borrowed from Lisp, an old functional language that I even didn’t play “hello world” with. For Python users, the idea of Map and Reduce is also very straightforward because the workhorse data structure in Python is just the list, a sequence of values that you can just imagine that they are the nodes(clusters, chunk servers, …) in a distributed system.

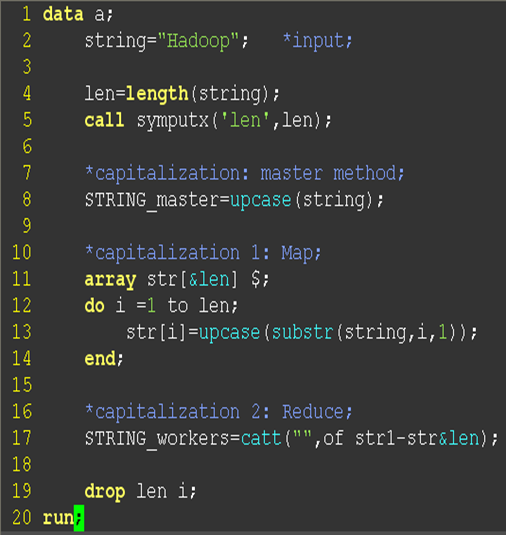
MapReduce is a programming framework and really language independent, so SAS users can also get the basic idea from their daily programming practices and here is just a simple illustration using data step array (not array in Proc FCMP or matrix in IML). Data step array in SAS is fundamentally not a data structure but a convenient way of processing group of variables, but it can also be used to play some list operations like in Python and other rich data structure supporting languages(an editable version can be founded in here):

MapReduce

More Read

Image
NoSQL vs. SQL: An Overview
Will Big Data Finally Turn CRM Into Something Valuable?
Hadoop in Advertising & Media: Is Data Analytics Making Old Media New?
Beware of Big Data Technology Zealotry
What Are Big Data, Hadoop and HDFS? 3 Must-Watch YouTube Videos

Follow code above, the programming task is to capitalize a string “Hadoop” (Line 2) and the “master” method is just to capitalize the string in buddle(Line 8): just use a master machine to processing the data.

Then we introduce the idea of “big data” that the string is too huge to one master machine, so “master method” failed. Now we distribute the task to thousands of low cost machines (workers, slaves, chunk servers,. . . in this case, the one dimensional array with size of 6, see Line 11), each machine produces parts of the job (each array element only capitalizes a single letter in sequence, see Line 12-14). Such distributing operation is called “map”. In a MapReduce system, a master machine is also needed to assign the maps and reduce.

How about “reduce”?  A “reduce” operation is also called “fold”—for example, in Line 17, the operation to combine all the separately values into a single value: combine results from multiple worker machines.

TAGGED:MapReduce
Share This Article
Facebook Pinterest LinkedIn
Share

Follow us on Facebook

Latest News

data analytics and truck accident claims
How Data Analytics Reduces Truck Accidents and Speeds Up Claims
Analytics Big Data Exclusive
predictive analytics for interior designers
Interior Designers Boost Profits with Predictive Analytics
Analytics Exclusive Predictive Analytics
big data and cybercrime
Stopping Lateral Movement in a Data-Heavy, Edge-First World
Big Data Exclusive
AI and data mining
What the Rise of AI Web Scrapers Means for Data Teams
Artificial Intelligence Big Data Exclusive

Stay Connected

1.2kFollowersLike
33.7kFollowersFollow
222FollowersPin

You Might also Like

Ring in the New Year with New Data Products

4 Min Read

The concept of non-relational analytics

3 Min Read

What Is a Data Scientist (and What Isn’t)?

7 Min Read

100 Petabytes of Data in Poop?

6 Min Read

SmartData Collective is one of the largest & trusted community covering technical content about Big Data, BI, Cloud, Analytics, Artificial Intelligence, IoT & more.

giveaway chatbots
How To Get An Award Winning Giveaway Bot
Big Data Chatbots Exclusive
data-driven web design
5 Great Tips for Using Data Analytics for Website UX
Big Data

Quick Link

  • About
  • Contact
  • Privacy
Follow US
© 2008-25 SmartData Collective. All Rights Reserved.
Go to mobile version
Welcome Back!

Sign in to your account

Username or Email Address
Password

Lost your password?