Cookies help us display personalized product recommendations and ensure you have great shopping experience.

By using this site, you agree to the Privacy Policy and Terms of Use.
Accept
SmartData CollectiveSmartData Collective
  • Analytics
    AnalyticsShow More
    unusual trading activity
    Signal Or Noise? A Decision Tree For Evaluating Unusual Trading Activity
    3 Min Read
    software developer using ai
    How Data Analytics Helps Developers Deliver Better Tech Services
    8 Min Read
    ai for stock trading
    Can Data Analytics Help Investors Outperform Warren Buffett
    9 Min Read
    media monitoring
    Signals In The Noise: Using Media Monitoring To Manage Negative Publicity
    5 Min Read
    data analytics
    How Data Analytics Can Help You Construct A Financial Weather Map
    4 Min Read
  • Big Data
  • BI
  • Exclusive
  • IT
  • Marketing
  • Software
Search
© 2008-25 SmartData Collective. All Rights Reserved.
Reading: The Great Debate: SAS vs. R
Share
Notification
Font ResizerAa
SmartData CollectiveSmartData Collective
Font ResizerAa
Search
  • About
  • Help
  • Privacy
Follow US
© 2008-23 SmartData Collective. All Rights Reserved.
SmartData Collective > R Programming Language > The Great Debate: SAS vs. R
R Programming LanguageStatistics

The Great Debate: SAS vs. R

lburtch
lburtch
3 Min Read
Image
SHARE

ImageI’ve been recruiting analytics talent for over 30 years, and now over the past few years I have watched open source R seemingly catapult to popularity alongside the proprietary standby SAS. Despite hearing more about R from clients and candidates than ever before, determining whether R was actually more popular than SAS proved difficult. A quick Google search for “R vs.

ImageI’ve been recruiting analytics talent for over 30 years, and now over the past few years I have watched open source R seemingly catapult to popularity alongside the proprietary standby SAS. Despite hearing more about R from clients and candidates than ever before, determining whether R was actually more popular than SAS proved difficult. A quick Google search for “R vs. SAS” returns more than a few pages dedicated to each side, as well as several heated LinkedIn discussions relating to the topic, with no definitive answers.

For my latest “flash survey” I wanted to quantify the preferences of the Burtch Works network, and asked one simple question: Which do you prefer to use, R or SAS? 

Image

More Read

Big Data Analytics a Key Enabler for Social CRM – Airlines Case Study
Using R in Production: Industry Experts Share Their Experiences
Open Data App for the Paris Métro
How They Fit Together: Bell Curves, Bayesian Inference and Black Swans
Musings on Watson: Why Healthcare?

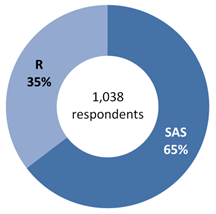
With even more participants responding that couldn’t seem to pick just one or picked neither, this tells me that such a seemingly simple question has a more complex answer. Here are just a few of the entertaining responses we received:

“I am a purist, so SAS.”

“R – unless you have a ‘both rock’ category – it’s a close one.”

“Never learned how to use R. Too damn old.”

“R. But isn’t the debate more between R and Python?”

“SAS as long as I’m not paying for it.”

“SAS. What’s ‘R’? (Joking…)”

 Curious as to how these results may vary by factors like industry or years of experience? I know I am! I can’t wait to dig into the data, and in the next few weeks will be posting a full write-up with our findings. Stay tuned!

To be the among the first to see all our latest job postings, blog posts and news – including our upcoming Data Scientist Salary Study – be sure to follow Burtch Works on LinkedIn.

Share This Article
Facebook Pinterest LinkedIn
Share

Follow us on Facebook

Latest News

data migration risk prevention
Best Approach to Risk Management for Data Migration in Data-Driven Businesses
Big Data Data Management Exclusive Risk Management
AI in branding
How Data Analytics and Data Mining Strengthen Brand Identity Services
Big Data Exclusive
Hidden AI, a risk?
Hidden AI, Real Risk: A Governance Roadmap For Mid-Market Organizations
Artificial Intelligence Exclusive Infographic
unusual trading activity
Signal Or Noise? A Decision Tree For Evaluating Unusual Trading Activity
Analytics Exclusive Infographic

Stay Connected

1.2KFollowersLike
33.7KFollowersFollow
222FollowersPin

You Might also Like

Paul Murrell on Incorporating Images in R Charts

3 Min Read
analytics and baseball
AnalyticsInside CompaniesStatistics

Analytics and Hedgehogs: Lessons from the Tampa Bay Rays

4 Min Read
Image
AnalyticsData MiningExclusiveHadoopPredictive AnalyticsStatisticsText AnalyticsUnstructured Data

Big Data and Your Body

5 Min Read

Target, Pregnancy, and Predictive Analytics, Part II

0 Min Read

SmartData Collective is one of the largest & trusted community covering technical content about Big Data, BI, Cloud, Analytics, Artificial Intelligence, IoT & more.

AI and chatbots
Chatbots and SEO: How Can Chatbots Improve Your SEO Ranking?
Artificial Intelligence Chatbots Exclusive
data-driven web design
5 Great Tips for Using Data Analytics for Website UX
Big Data

Quick Link

  • About
  • Contact
  • Privacy
Follow US
© 2008-25 SmartData Collective. All Rights Reserved.
Welcome Back!

Sign in to your account

Username or Email Address
Password

Lost your password?