

Data Visualization plays a very significant role in the world of Business Intelligence (BI). By efficiently identifying trends and patterns, Data Visualization helps the user quickly understand and relate to the data, without having to painstakingly sift through it. However, there are many factors to consider when evaluating a BI tool in this regard. In this context, we would like outline some of the criteria involved in this process.
- Big Data and predictive analytics – Insights into huge volumes of data (structured and unstructured) can be better shown with visualization. BI tools provide connectors into Hadoop Distributed File System (HDFS) to aid in the data discovery process and, in turn, provide the ability to make quicker and better decisions. The BI tools should mask the complicated mathematical formulae and algorithms designed to analyze the big data and deliver intuitive and interactive data-products.
- Visualization on mobile devices – Specific to Data Visualization and BI, one of the obvious things to look for is support for easy and seamless display on mobile devices. Many popular BI products provide this functionality out-of-the-box, but you need to make sure your BI team understands the complexity involved before you start this initiative. Extensive support from the infrastructure/networking team is a critical success factor.
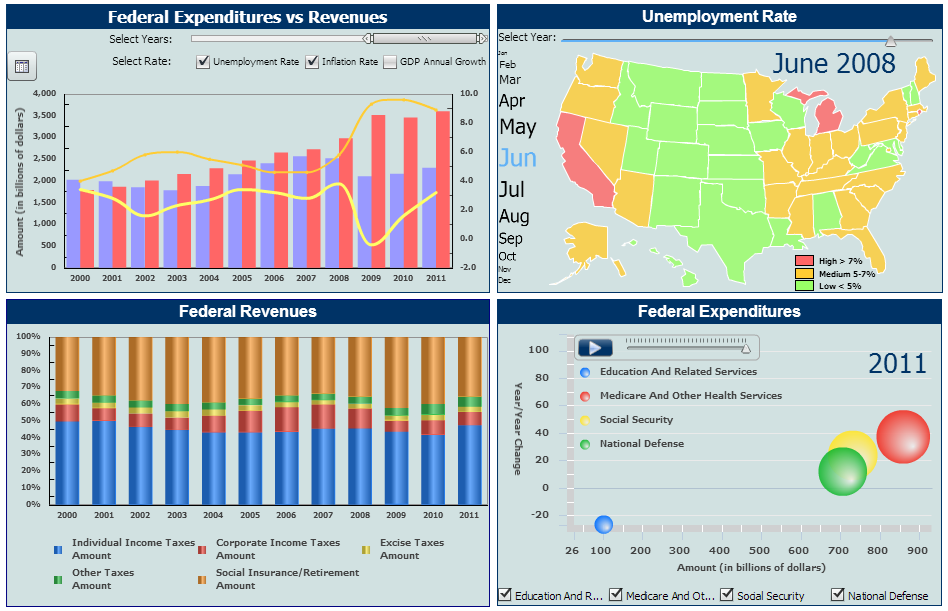
- Geographic Information Systems (GIS) and map-based visualization – Visualizing location-based data can have a very powerful impact when the content is displayed on a map. The map interface should aid the user in performing additional data exploration on a visual level, while providing spatial context. The interface should have the capability to filter the data and provide additional detail as needed. Popular BI tools provide connectors/plug-ins to integrate seamlessly into popular mapping layers like Google Maps or Mapinfo.
- Animation – Another criteria discussed in this context is the support for animation. If the user wants to track how a particular metric changed over a period of time, it is easier to visualize if there is an animation script that shows the change over a period of time with one click (rather than clicking on each year). Some of the BI products available in the market support this functionality in the “Desktop mode” (using the thick-client), but do not support it when the same data-product is visualized using a web-browser. Another common issue in this regard is the support for animation only when using certain objects. For example, a popular BI tool supports animation for a bubble-graph, but it doesn’t provide the same support for a map widget.
- Stand-alone “offline” support – Once less common a few years ago, this feature is now a supported functionality by most BI tools now. It is important to ensure that the constructed data-output can work independent of a server, and not necessarily only when a connection to said server exists. This functionality can help you deploy the content on the internet without exposing the enterprise BI server to the world-wide web. Many popular BI products let you export a MIME HTML file (.mht file format) that can later be converted into Flash and HTML file formats before the content is deployed for consumption.
- Ability to drill into detail – Data visualized through graphs or by other sophisticated data-products like Dashboards or Key Performance Indicators (KPIs) gain user adoption if they encourage the user to drill into data. The BI tools should provide the right platform to encourage the user to ask questions about the data being visualized and provide an option for the user to drill into the detailed granular data from the visualized data-product.
- Easy access to tabular data – Not all the business problems could be addressed by data visualization alone. BI tools should provide an interface for the user to easily toggle between a graph visualization and tabular data. This helps the user trust the visualization further and encourage user adoption.
 To summarize, all the popular BI tools in the market offer advanced data visualization features and functionality, but we recommend that you perform extensive analysis before a BI tool is selected for its visualization capabilities. Setup and maintenance costs, ease of use, scalability and business understanding can greatly impact the business user adoption of the final end product.


