Using R and Motion Charts to analyze financial data
We've noted before that with the RGoogleVis package, it's easy to make motion charts in R, and create a web-based…


10 reasons why a grad student should use R
Kevin Goulding is working on a Master’s degree in Applied Economics at Montana State University, and offers 10 reasons why…
Paul Murrell on Incorporating Images in R Charts
Thanks to everyone at who attended this week's Bay Area R User Group meeting, and a special thanks to our…

Bus commuting made tolerable with real-time data
Most of the whining and moaning about Sydney’s public transport is usually directed at the rail network. But just think…
Emotion Reading Technology Matures
“The system can tell that a man comes by a preschool every day at recess,” an executive at a video…

The Importance of Good Visualizations
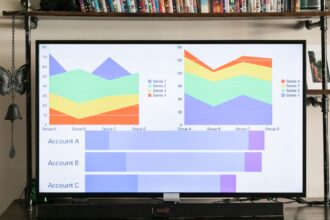
As children we go to the eye doctor regularly to make sure our vision is okay and that we can…


Big Data Is The Next Frontier For Innovation, Competition and Productivity
Author: Steve McDonnellSpotfire Blogging TeamLast month I blogged about Big Data challenges and opportunities. This month I want to elaborate…

You and Your Avatars
If you and I talk on our cell phones, we're actually not speaking with each other, but with each other's…


Independence Day Infographics Explode onto the Data Scene
Guest Post: Linda RosencranceAs the United States celebrates Independence Day, many pause to appreciate this country’s wealth of history and…

Wow vs. Ah-ha: Artists and Practitioners in Data Visualization
I returned this week from the Eyeo festival, a gathering of many of the world’s most influential and innovative data…