We use cookies, including third-party cookies from Google to serve personalized ads through AdSense, to operate this site and understand how it is used. By continuing to browse, you accept this use. See our Privacy Policy and Terms of Use for details, including how to opt out of personalized advertising.
Accept
SmartData CollectiveSmartData Collective
  • Analytics
    AnalyticsShow More
    chatgpt image jul 21, 2026, 04 34 30 pm
    4 Core Benefits of Predictive Maintenance after Vibration Analysis
    10 Min Read
    How Does Data Mining Boost Customer Satisfaction in Logistics? Harnessing Analytics for Results -- AI-generated illustration
    How Does Data Mining Boost Customer Satisfaction in Logistics? Harnessing Analytics for Results
    11 Min Read
    chatgpt image jul 13, 2026, 04 23 45 pm
    How Data Analytics Helps Companies Improve User Engagement
    19 Min Read
    chatgpt image jul 13, 2026, 03 59 46 pm
    How Data Analytics Improves Multi-Location Search Strategies
    10 Min Read
    cybersecurity efforts
    How Behavioral Analytics and AI Are Redefining Cybersecurity for Boca Raton Businesses
    14 Min Read
  • Big Data
  • BI
  • Exclusive
  • IT
  • Marketing
  • Software
Search
© 2008-25 SmartData Collective. All Rights Reserved.
Reading: Applying Big Data to 2011 Holiday Shopping Information
Share
Notification
Font ResizerAa
SmartData CollectiveSmartData Collective
Font ResizerAa
Search
  • About
  • Help
  • Privacy
Follow US
© 2008-23 SmartData Collective. All Rights Reserved.
SmartData Collective > Big Data > Data Mining > Applying Big Data to 2011 Holiday Shopping Information
AnalyticsBusiness IntelligenceData Mining

Applying Big Data to 2011 Holiday Shopping Information

Brett Stupakevich
Brett Stupakevich
4 Min Read
Applying Big Data to 2011 Holiday Shopping Information
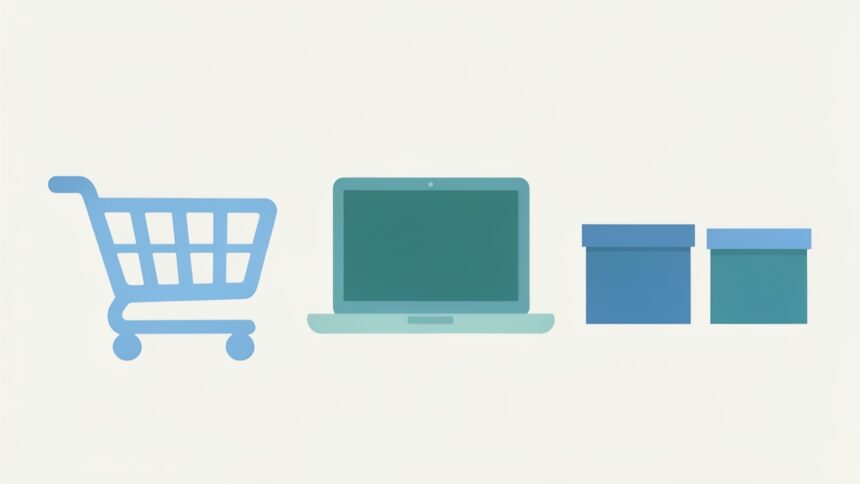
Illustration generated with FLUX.2 [klein 4B] via Cloudflare Workers AI.
SHARE

By most measures, 2011 holiday sales saw solid gains. Overall retail sales rose 4.1%, according to the National Retail Federation. And while 2011 holiday sales didn’t achieve the 5.2% gains made during the 2010 holiday season, they still outpaced the 2.6% growth over the past decade.

But a closer examination shows that not all categories fared well. For example, sales of “mature” consumer electronics devices dipped 5.9% during the Nov. 20 to Dec. 24 sales period, according to The NPD Group. Yet not all consumer electronics suffered. For example, 3DTV sales grew more than 100%, according to The NPD Group. 

Retailers, consumer packaged goods (CPGs) and other types of companies can glean valuable insights about consumers by using big data to examine holiday spending patterns and market basket analysis by customer segment. Business leaders can also use predictive analytics to help identify and provide more relevant upsell and cross-sell offers.

Retailers and consumer packaged goods companies can apply analytics to learn – and even prosper – from the multiple takeaways gathered during the 2011 holiday shopping season. For example, while overall holiday spending was up, department store retailers such as J.C. Penney and Kohl’s discovered that deep and extended discounting during the holidays may have eaten into profits.

More Read

Business Intelligence Analytics Tools
Leveraging Data with Business Intelligence Analytics Tools
How Business Intelligence Tools Revolutionized the Businesses
What’s the Big Deal About Big Data?
SKF: Inverse Construction and Volatility
Pushing the Data Visualization Envelope: an Interview with Tableau’s Ellie Fields

Thanks to the use of analytics, retailers have become much more adept at identifying the degree to which they can discount products and still achieve certain profit margins. Analytics can also help retailers look more closely at correlations between discounting certain items and the cross-sell opportunities these might create (e.g. if we offer 30% off this set of children’s coats, what’s the likelihood that shoppers will also purchase hats, scarves, and/or gloves that are priced at X?).

Market basket analysis can also provide retailers and CPGs rich insights into potential upsell or cross-sell opportunities with customers. For instance, if a consumer buys a high-definition television set from Best Buy, the electronics giant typically follows up by email or through other channels to offer complementary products or services, such as HDMI cables, entertainment stands, or Geek Squad services to optimize the quality of the high-definition picture.

Even though the holiday shopping season has technically passed, Best Buy is still reaching out to consumers with relevant offers. Of course, the typical HDTV buyer has likely purchased all of the additional support equipment and services he needs. Nevertheless, Best Buy does an effective job of casting its net out to those stragglers who still need an additional item or two.

Retailers and CPGs can glean other insights from 2011 holiday shopping trends. For example, companies can gain a better understanding of the channels that shoppers tend to use to purchase certain items. From that information, companies can develop more targeted and relevant offers to consumers based on a better understanding of their needs, preferences, and current lifecycle status (e.g. young couple with two toddler-age children).

Some retailers and CPGs accrue up to 40% of their total annual revenue volume during the holiday shopping frenzy. But companies that mine this data effectively can arm themselves with valuable business intelligence that can extend well after the last of the holiday decorations has been stored away.

Next Steps:

Register for our complimentary webcast at 11am on February 2nd entitled:  “Advanced Analytics in Customer Relationship Management:Key to Cross-Channel Efficiency and Engagement.”


TAGGED:big data
Share This Article
Facebook Pinterest LinkedIn
Share

Follow us on Facebook

Latest News

Analyst points at colorful circular data dashboard on screen - information technology business metrics
How Fragmented Workplace Tech Undermines Reliable Business Metrics and Reporting
Cloud Computing Exclusive Infographic IT
Using Multi-Source Data and Analytics to Detect Operational Drift Across Franchise Networks -- AI-generated illustration
Using Multi-Source Data and Analytics to Detect Operational Drift Across Franchise Networks
Exclusive Infographic
Beyond The First Impression: The Long-Lasting Impact Of Sensory Marketing -- AI-generated illustration
Beyond The First Impression: The Long-Lasting Impact Of Sensory Marketing
Infographic Marketing
The Infrastructure Gap Slowing Data Center Growth -- AI-generated illustration
The Infrastructure Gap Slowing Data Center Growth
Big Data Cloud Computing Exclusive Infographic IT

Stay Connected

1.2KFollowersLike
33.7KFollowersFollow
222FollowersPin

You Might also Like

5 Ways Big Data is Fueling the Sharing Economy
Big DataBusiness IntelligenceExclusiveMarket ResearchNews

5 Ways Big Data is Fueling the Sharing Economy

6 Min Read
Big Data Is A Huge Boost To Emerging Telecom Markets
Big Data

Big Data Is A Huge Boost To Emerging Telecom Markets

6 Min Read
How Are Predictive Analytics Shaping the Future of Fintech?
AnalyticsFintechPredictive Analytics

How Are Predictive Analytics Shaping the Future of Fintech?

6 Min Read
How Big Data Technology Impacts Investments and Trading
Big DataBusiness IntelligenceExclusive

How Big Data Technology Impacts Investments and Trading

5 Min Read

SmartData Collective is one of the largest & trusted community covering technical content about Big Data, BI, Cloud, Analytics, Artificial Intelligence, IoT & more.

The Art of Conversation: Enhancing Chatbots with Advanced AI Prompts
Chatbots
5 Great Tips for Using Data Analytics for Website UX
Big Data

Quick Link

  • About
  • Contact
  • Privacy
Follow US
© 2008-26 SmartData Collective. All Rights Reserved.
Welcome Back!

Sign in to your account

Username or Email Address
Password

Lost your password?